
Figure 5.
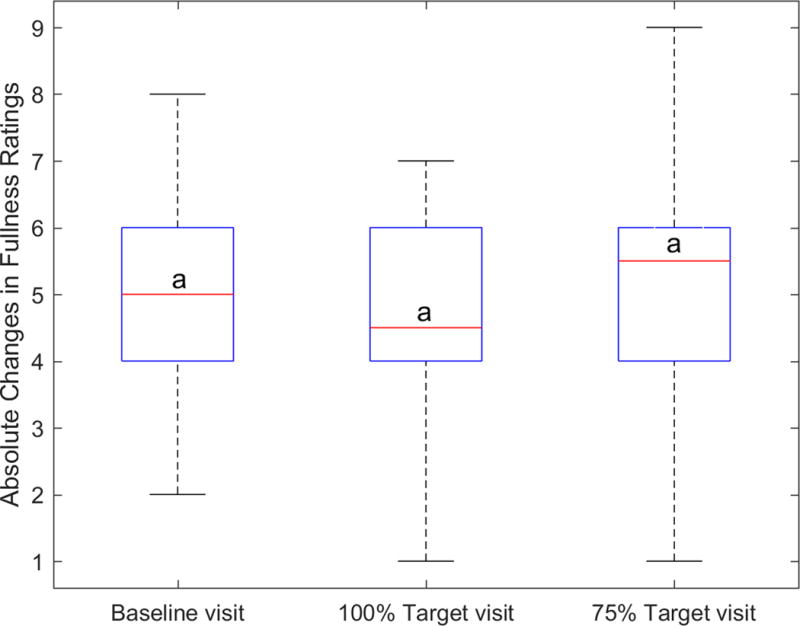
Distribution of absolute changes in the fullness rating between the start and end of the meal. Fullness before and after the meal was measured using standard 1–9 scale. No significant differences were observed for changes in fullness ratings for different visits. For each plot, the red line indicates the corresponding median change in rating. Upper and lower whiskers show the minimum and maximum changes within 25th and 75th percentile, respectively. Lower and upper horizontal blue lines (on the box) indicate 1st and 3rd quartile i.e. q1 and q3. 50% of the cases are between 1st and 3rd quartile. (Left) The letter ‘a’ at the median line indicates that the medians values are not significantly different.