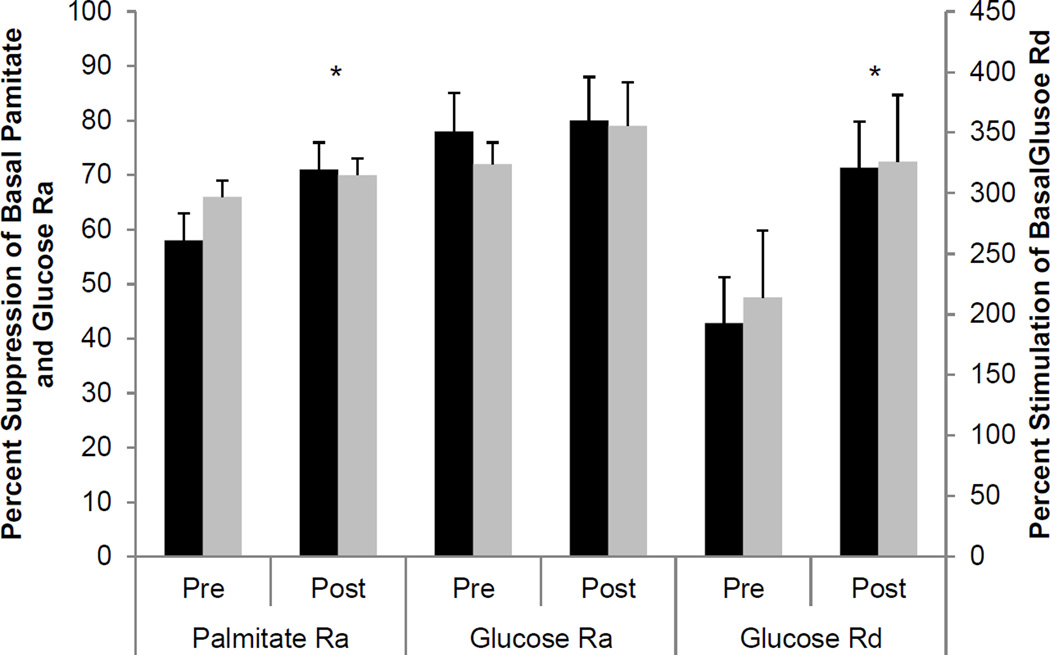
Figure 1.
Percent suppression of palmitate Ra and glucose Ra during stage 1 of the hyperinsulinemic-euglycemic clamp procedure and percent stimulation of glucose Rd during stage 2 of the hyperinsulinemic-euglycemic clamp procedure before and after weight loss in HIV− (black bars) and HIV+ subjects (grey bars). * Main effect of time, P < 0.05

