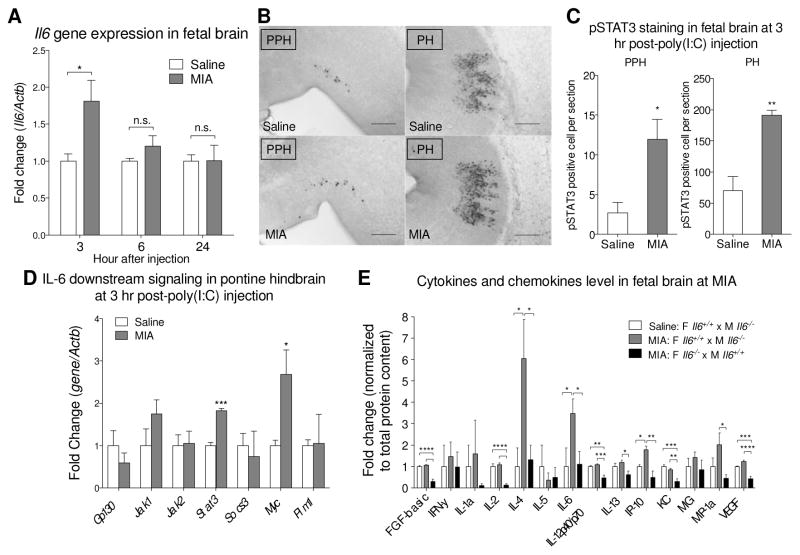
Fig. 1.
MIA induces an acute immune response in the fetal brain. (A) The level of IL-6 in fetal brain was measured by qPCR. Fetal brains from poly(I:C)-injected dam exhibit elevated Il6 gene expression at 3 hours post-injection (t10 = 2.732, p = 0.0211; Student’s two-tailed unpaired t test). No difference in Il6 gene expression is observed between saline and MIA fetal brains at 6 and 24 hours post-injection. (3 hr: Saline n = 6 litters (16 embryos); MIA n = 6 litters (18 embryos); 6 hr and 24 hr: Saline n = 3 litters (9 embryos); MIA n = 3 litters (9 embryos). Il6 gene expression was normalized to β-actin. Gene expression was normalized to β-actin. (B) pSTAT3 is increased in MIA fetal hindbrain at 3 hours post-poly(I:C) injection. Representative images of pSTAT3 staining in sagittal sections of the MIA fetal prepontine hindbrain (PPH) and pontine hindbrain (PH). Scale bar = 200 μm. (C) Quantification of pSTAT3+ cells in the fetal PPH (t7 = 3.038, p = 0.0189) and PH (t6 = 3.888, p = 0.0081) (Student’s two-tailed unpaired t test). Saline n = 4 litters (7 embryos); MIA n = 5 litters (5 embryos). (D) Downstream signaling molecules of the IL-6 pathway in fetal MIA and control LCM samples are analyzed by qPCR. The results are normalized to β-actin using the ddCT method. Stat3 (t4 = 9.483, p = 0.0007) and Myc (t4 = 2.810, p = 0.0483) expression are significantly increased in the PH area after MIA (Student’s two-tailed unpaired t test). Saline n = 3 litters (7–9 embryos); MIA n = 3 litters (9–10 embryos). (E) Luminex cytokine array indicates that MIA-mediated alterations in fetal brain cytokines and chemokines depend on maternal IL-6 genotype. Values were normalized to white bar. Data shows that maternal poly(I:C) injection induces cytokine levels in fetal brain and that maternal IL-6 is required for induction of fetal brain IL-4 (Saline WT dam v.s. MIA WT dam p = 0.0176; MIA WT dam v.s. MIA KO dam p = 0.0238), IL-6 (Saline WT dam v.s. MIA WT dam p = 0.0397; MIA WT dam v.s. MIA KO dam p = 0.0465), IP-10 (Saline WT dam v.s. MIA WT dam p = 0.0201; MIA WT dam v.s. MIA KO dam p = 0.0012) and for maintaining baseline levels of FGF-basic (Saline WT dam v.s. MIA KO dam p < 0.0001; MIA WT dam v.s. MIA KO dam p < 0.0001), IL-2 (Saline WT dam v.s. MIA KO dam p < 0.0001; MIA WT dam v.s. MIA KO dam p < 0.0001), KC (Saline WT dam v.s. MIA KO dam p = 0.0002; MIA WT dam v.s. MIA KO dam p = 0.0012), VEGF (Saline WT dam v.s. MIA KO dam p = 0.0004; MIA WT dam v.s. MIA KO dam p < 0.0001) (One-way ANOVA with Fisher’s LSD post-hoc test). All groups n = 4 litters (4 embryos per group). Cytokine levels were normalized to total protein content. * p < 0.05, ** p < 0.01, *** p < 0.001, **** p < 0.0001 v.s. saline control. Data are presented as mean ± SEM. n.s.: not significant.

