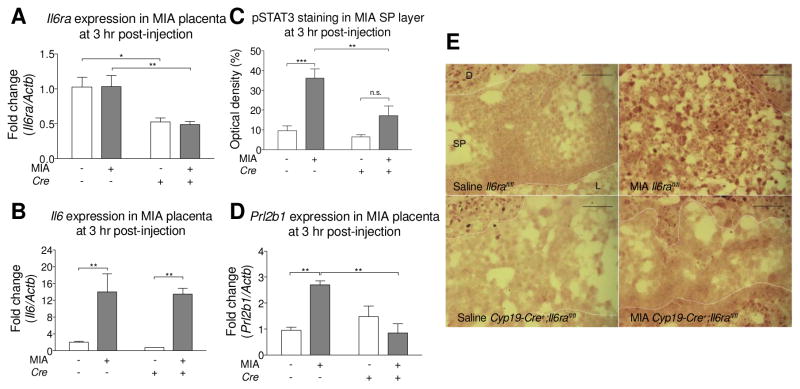
Fig. 2.
Deletion of placental trophoblast Il6rafl/fl decreases STAT3 activation, but not IL-6 production after MIA. (A) The level of IL-6Rα in placenta was measured by qPCR. Il6ra expression is decreased in the Cyp19-Cre+;Il6rafl/fl placenta. There is no effect of MIA on placental Il6ra expression. All groups n = 3 litters (6, 9, 4, 8 placentas were used for Saline Cre−; MIA Cre−; Saline Cre+; MIA Cre+, respectively) (MIA: F(1,8) = 0.08604, p = 0.8774; Cre: F(1,8) = 72.66, p = 0.0017; MIAxCre: F(1,8) = 0.1413, p = 0.8433; Post hoc- Cre− v.s. Cre+: Saline p = 0.0140, MIA p = 0.0091) (Two-way ANOVA with Fisher’s LSD post-hoc test). (B) The level of IL-6 in placenta was measured by qPCR. MIA increases Il6 gene expression in both Il6rafl/fl and Cyp19-Cre+;Il6rafl/fl placentas. There is no effect of Il6ra genotype on placental Il6 gene expression in response to MIA. Il6 gene expression was normalized to β-actin. All groups n = 3 litters (6, 9, 4, 8 placentas were used for Saline Cre−; MIA Cre−; Saline Cre+; MIA Cre+, respectively) (MIA: F(1,8) = 78.65, p = 0.0006; Cre: F(1,8) = 0.4826, p = 0.6780; MIAxCre: F(1,8) = 0.06658, p = 0.8768; Post hoc- Saline v.s. MIA: Cre− p = 0.0054, Cre+ p = 0.0039) (Two-way ANOVA with Fisher’s LSD post-hoc test). (C) Quantification of pSTAT3 optical density in the placental spongiotrophoblast (SP) layer. All groups n = 3 litters (3 placentas per group). (MIA: F(1,8) = 25.34, p = 0.001; Cre: F(1,8) = 8.906, p = 0.0175; MIAxCre: F(1,8) = 4.794, p = 0.06; Post hoc- Saline v.s. MIA: Cre− p = 0.0009, Cre+ p = 0.0791; Cre− v.s. Cre+: Saline p = 0.5895, MIA p = 0.0064) (Two-way ANOVA with Fisher’s LSD post-hoc test) (D) The level of Prolactin family 2 subfamily b member 1 hormone in placenta was measured by qPCR. MIA increases Prl2b1 expression in the Il6rafl/fl placenta. This elevation is prevented in placentas from MIA Cyp19-Cre+;Il6rafl/fl mice. All groups n = 3 litters (5, 6, 5, 6 placentas were used for Saline Cre−; MIA Cre−; Saline Cre+; MIA Cre+, respectively) (MIA: F(1,8) = 3.657, p = 0.0922; Cre: F(1,8) = 5.159, p = 0.0528; MIAxCre: F(1,8) = 16.58, p = 0.0036; Post hoc- Saline v.s. MIA: Cre− p = 0.0029, Cre+ p = 0.1653; Cre− v.s. Cre+: Saline p = 0.2388, MIA p = 0.0020) (Two-way ANOVA with Fisher’s LSD post-hoc test). (E) Representative images of pSTAT3 in the SP layer of saline Il6rafl/fl, MIA Il6rafl/fl, saline Cyp19-Cre+;Il6rafl/fl, and MIA Cyp19-Cre+;Il6rafl/fl placentas. Scale bar = 100 μm. * p < 0.05, ** p < 0.01, *** p < 0.001 between groups. Data are presented as mean ± SEM. D: decidua, L: labyrinth, n.s.: not significant.

