Fig. 3.
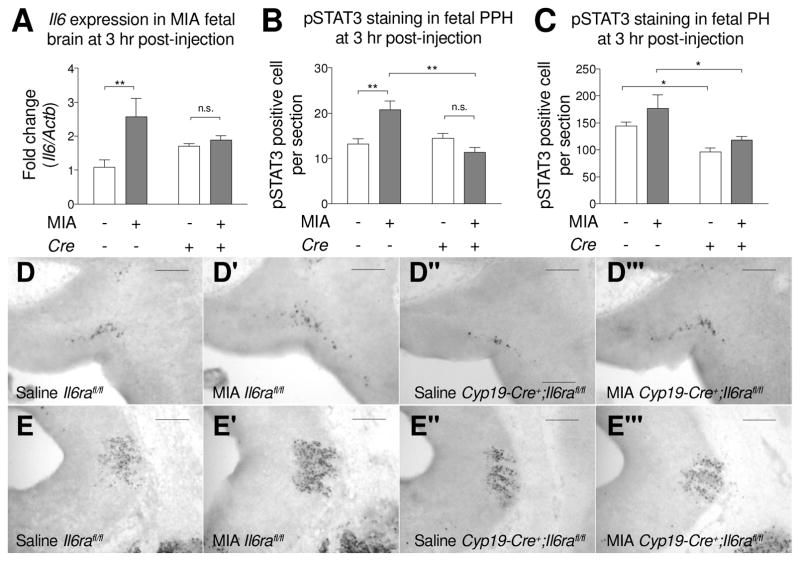
Deletion of placental trophoblast Il6ra prevents MIA-induced acute responses in the fetal brain. (A) Fetal brain IL-6 gene expression was measured by qPCR. MIA increases Il6 gene expression in the Il6rafl/fl fetal brain, but not in Cyp19-Cre+;Il6rafl/fl fetal brain. Il6 gene expression was normalized to β-actin. All groups n = 3 litters (8, 7, 8, 12 fetal brains were used for Saline Cre−; MIA Cre−; Saline Cre+; MIA Cre+, respectively). (MIA: F(1,8) = 8.043, p = 0.0219; Cre: F(1,8) = 0.01323, p = 0.9113; MIAxCre: F(1,8) = 4.883, p = 0.0581; Post hoc- Saline v.s. MIA: Cre− p = 0.0073, Cre+ p = 0.6696) (Two-way ANOVA with Fisher’s LSD post-hoc test) (B–C) Quantification of pSTAT3+ cells in the fetal (B) prepontine hindbrain (PPH) (MIA: F(1,8) = 2.956, p = 0.1239; Cre: F(1,8) = 9.251, p = 0.0160; MIAxCre: F(1,8) = 15.96, p = 0.0040; Post hoc- Saline v.s. MIA: Cre− p = 0.0037, Cre+ p = 0.1463; Cre− v.s. Cre+: Saline p = 0.5192, MIA p = 0.0011) and (C) pontine hindbrain (PH) (MIA: F(1,8) = 3.757, p = 0.0886; Cre: F(1,8) = 14.50, p = 0.0052; MIAxCre: F(1,8) = 0.1662, p = 0.6942; Post hoc- Cre− v.s. Cre+: Saline p = 0.0429, MIA p = 0.0176). All groups n = 3 litters (6, 7, 3, 6 fetal brains were used in Saline Cre−; MIA Cre−; Saline Cre+; MIA Cre+, respectively) (Two-way ANOVA with Fisher’s LSD post-hoc test). pSTAT3+ cells are more abundant in MIA-induced in Il6rafl/fl fetal PPH compared to saline controls. Reduction of pSTAT3+ cells in the fetal PPH is observed in Cyp19-Cre+;Il6rafl/fl compared to Il6rafl/fl fetus following MIA. (D–E) Elevation of pSTAT3 in MIA fetal hindbrain is prevented when knockout of Il6ra in plcantal trophoblast. Representative images of pSTAT3 staining in sagittal sections of saline Il6rafl/fl, MIA Il6rafl/fl, saline Cyp19-Cre+;Il6rafl/fl and MIA Cyp19-Cre+;Il6rafl/fl fetal PPH (D) and PH (E). Scale bar = 200 μm. * p < 0.05, ** p < 0.01 between groups. Data are presented as mean ± SEM. n.s.: not significant.

