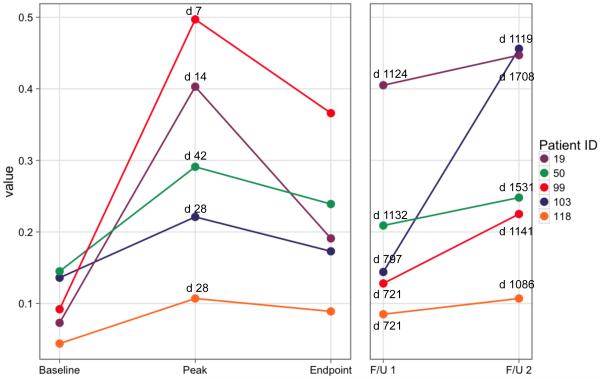
Figure 1.
Stimulated parotid salivary flow rates of the targeted gland at key time points from each subject responding positively to AdhAQP1 treatment. The color-coding for subjects in this figure are the same as in Figure 3, and as those published in Baum et al 12. The Y-axis shows salivary flow in mL/min from the targeted parotid gland. The X-axis shows five key time points in this study, with the specific days for each indicated above data points in the figure. Baseline represents each subject’s initial visit to the NIH Clinical Center prior to any procedures being performed. The initial peak increase in salivary flow represents the time point (varied from day 7-42) following AdhAQP1 administration when the subject’s parotid salivary flow was maximal. Both the Baseline and initial peak data were presented previously in Baum et al 12. The endpoint of the originally approved study was on day 360 visit after vector delivery for each subject. Thereafter, the original clinical protocol was amended and we received permission to evaluate the effects of AdhAQP1 administration to all five responder-subjects for an additional two years of follow-up. The exact days following vector administration for the two follow-up visits are different for each subject (shown also in Table 1). They are shown in the figure and are as follows: #19 (days 1124 and 1708, respectively), #50 (1132 and 1531), #99 (721 and 1141), #103 (797 and 1119), and #118 (721 and 1086).

