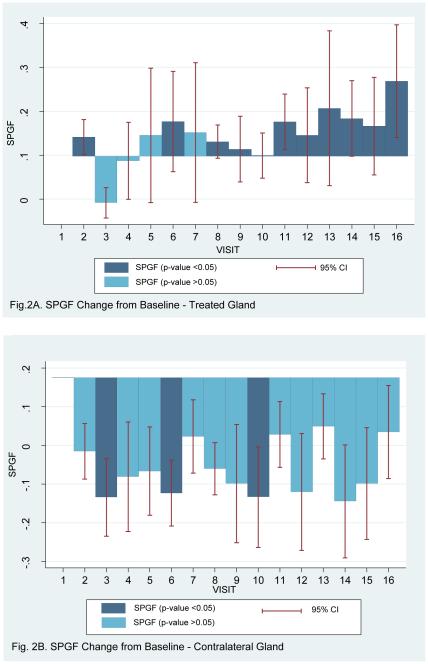
Figure 2.
Depiction of the changes from baseline for stimulated parotid salivary flow rates at each time point in this clinical trial from the AdhAQP1-treated gland (A) and the contralateral untreated gland (B). Statistical significance is indicated using the dark (p<0.05) and light blue (p>0.05) shading of each bar, and the 95% confidence intervals are depicted. Bars above the line represent an increase in salivary flow rate, while those below indicate a decrease in salivary flow rate. Statistical analysis used GEE modeling as presented in Tables 2 and 3. Visit numbers represent the following time points: 1 (baseline), 2 (6 hours), 3 (day 1), 4 (day 2), 5 (day 3), 6 (day 7), 8 (day 28), 9 (day 42), 10 (day 90), 11 (day 120), 12 (day 150), 13 (day 180, 14 (day 360), 15 (follow-up visit 1), 16 (follow-up visit 2). The exact times for the two follow-up visits are presented in Figure 1 and its legend.

