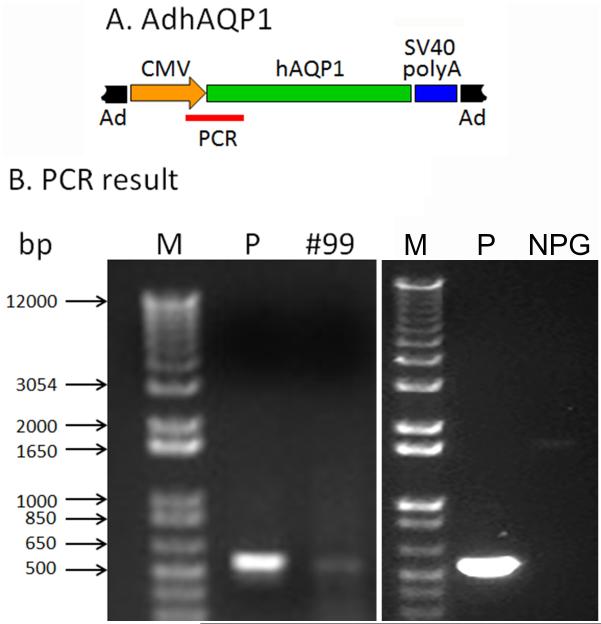
Figure 6.
Results of conventional PCR assay with DNA extracted from tissue obtained with a modified sialoendoscopic biopsy of subject # 99. See SUBJECTS AND METHODS for details of the PCR reaction conditions and primers. A. Schematic diagram of AdhAQP1 with the region of the PCR amplicon shown as a red line. The Ad5 genome is shown in black. The human cytomegalovirus promoter (CMV) is shown in orange. The human aquaporin-1 transgene is shown in green, followed by the SV40 polyadenylation signal shown in blue. B. PCR Result. Lane M contains DNA standard markers (sizes shown to left). In the left panel, lane P is the positive control sample and shows the 565 bp amplicon as obtained from an extract of AdhAQP1. Lane #99 shows the same 565 bp amplicon, which was obtained from DNA extracted from the targeted parotid gland tissue of subject 99 at follow-up visit 1 (day 721 after AdhAQP1 administration). In the right panel, lanes M and P are the same, but the sample in the lane labeled NPG was obtained from the normal parotid gland of a male volunteer who had not been administered AdhAQP1.

