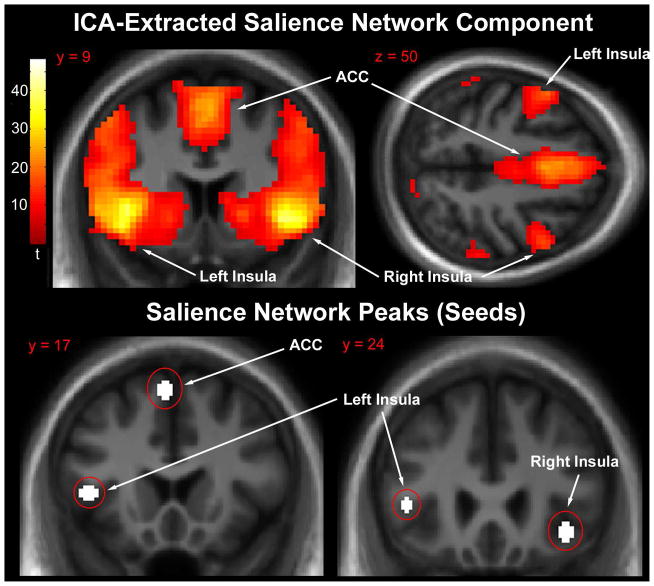
Fig. 2.
Top: Mean salience network component extracted by independent components analysis. Significant clusters were centered on the anterior cingulate and bilateral insula. Statistical parametric map thresholded at whole-brain voxelwise cluster family-wise error rate corrected p < 0.05 purely for visualization purposes. Images are presented in the neurologic convention (R on R). Bottom: Location of salience network peaks (5 mm spheres) used as seeds for connectivity analysis.

