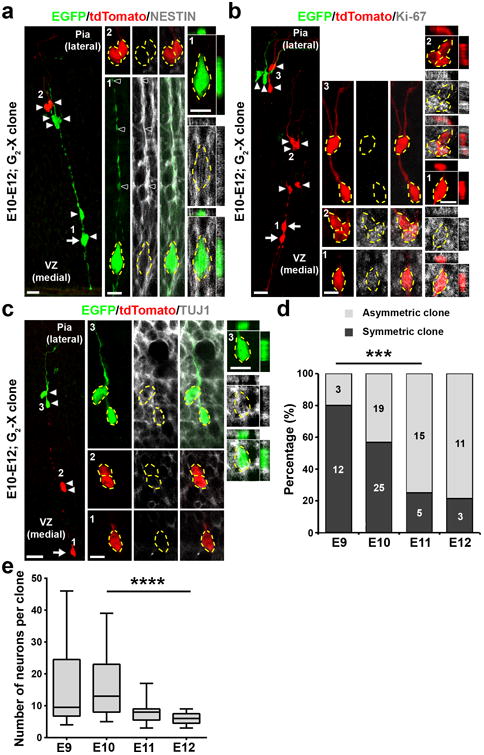
Figure 2. Cellular composition of MADM-labeled embryonic thalamic clones.

(a) Confocal image of an E12 G2-X clone labeled at E10 and stained for EGFP (green), tdTomato (red), and NESTIN (white), a neural progenitor marker. The arrow indicates the RGP and arrowheads indicate the progeny. High magnification images (areas 1 and 2) are shown in the middle and cross-section images are shown to the right. Broken lines indicate the cell bodies. Scale bars: 20 μm, 10 μm, and 10 μm. (b) Confocal image of an E12 G2-X clone labeled at E10 and stained for EGFP (green), tdTomato (red), and Ki-67 (white), a proliferation marker. Arrows indicate the bipolar RGPs and arrowheads indicate the progeny. High magnification images (areas 1-3) are shown in the middle and cross-section images are shown to the right. Broken lines indicate the cell bodies. Scale bars: 20 μm, 10 μm, and 10 μm. (c) Confocal image of an E12 G2-X clone labeled at E10 and stained for EGFP (green), tdTomato (red), and TUJ1 (white), a neuronal marker. The arrow indicates the RGP and arrowheads indicate the progeny. High magnification images (areas 1-3) are shown in the middle and cross-section images are shown to the right. Broken lines indicate the cell bodies. Scale bars: 20 μm, 10 μm, and 10 μm. (d) Percentage of symmetric (Sym.) vs. asymmetric (Asym.) thalamic clones labeled at different embryonic stages and examined two days later (E9, n=15 clones; E10, n=44 clones; E11, n=20 clones; E12, n=14 clones). ***, p=0.0006 (chi-square test for linear trend).(e) Quantification of the average number of neurons in individual green/red G2-X clones labeled at different embryonic stages and examined at P21-24 (E9, n=10 clones; E10, n=23 clones; E11, n=13 clones; E12, n=9 clones). Data are presented as median with interquartile range, and whiskers are the minimum and maximum. ****, p=2.5e-05 (linear regression analysis).
