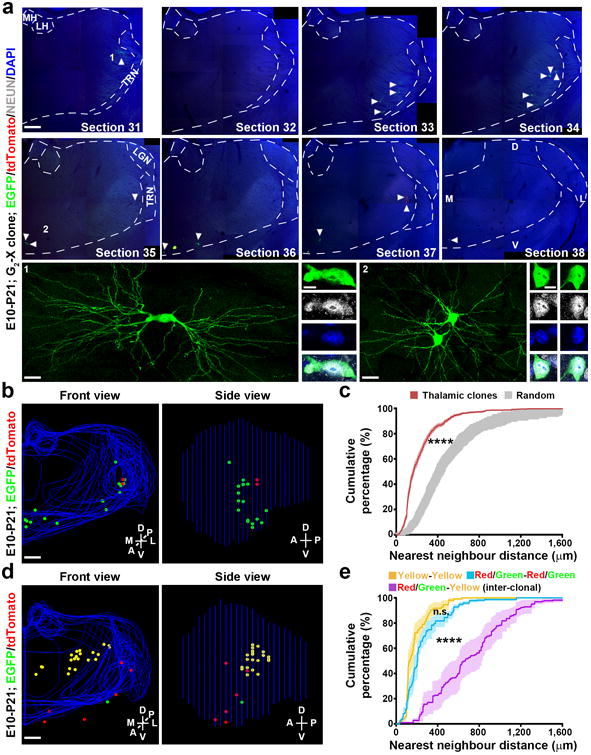
Figure 3. Spatial clustering of clonally related neurons in the thalamus at the mature stage.

(a) Confocal images of a green/red G2-X clone in a P21 brain treated with TM at E10. Consecutive sections were stained for EGFP (green) and tdTomato (red), and with DAPI (blue). Broken lines indicate the contours of the thalamus and landmark nuclei including the medial and lateral habenula (MH, LH), lateral geniculate nucleus (LGN), and the thalamic reticular nucleus (TRN). Arrowheads indicate the labeled neurons. High magnification images of representative labeled neurons positive for neuronal marker NEUN (white) (areas 1 and 2) are shown at the bottom. Scale bars: 500 μm, 20 μm, 10μm, 20 μm, and 10μm. (b) 3D reconstructed images of the thalamic hemisphere containing the clone shown in a (Front view, left; Side view, right). Blue lines indicate the contours of the thalamus and landmark nuclei and colored dots represent the cell bodies of labeled neurons. M, medial; L, lateral; D, dorsal; V, ventral; A, anterior; P, posterior. Similar display is used in subsequent 3D reconstructed images. Scale bar: 500 μm. (c) Nearest neighbor distance (NND) analysis of MADM-labeled neuronal clones (n=77) in the P21-24 thalamus. Data are presented as mean±s.e.m. ****, p=1e-15 (unpaired t-test with Welch's correction). (d) 3D reconstructed images of a thalamic hemisphere containing both a green/red G2-X clone and a yellow clone. Scale bar: 500 μm. (e) NND analysis of MADM-labeled green/red and yellow neuronal clones in the same thalamic hemisphere. Note that the cumulative frequency of NND of green/red (blue, n=11) or yellow (yellow, n=11) fluorescent neurons (i.e. intra-clonal) is similar and significantly left-shifted than that of green/red and yellow (magenta, n=11) fluorescent neurons (i.e. inter-clonal). Data are presented as mean±s.e.m. ****, p=1e-15 (unpaired t-test with Welch's correction).
