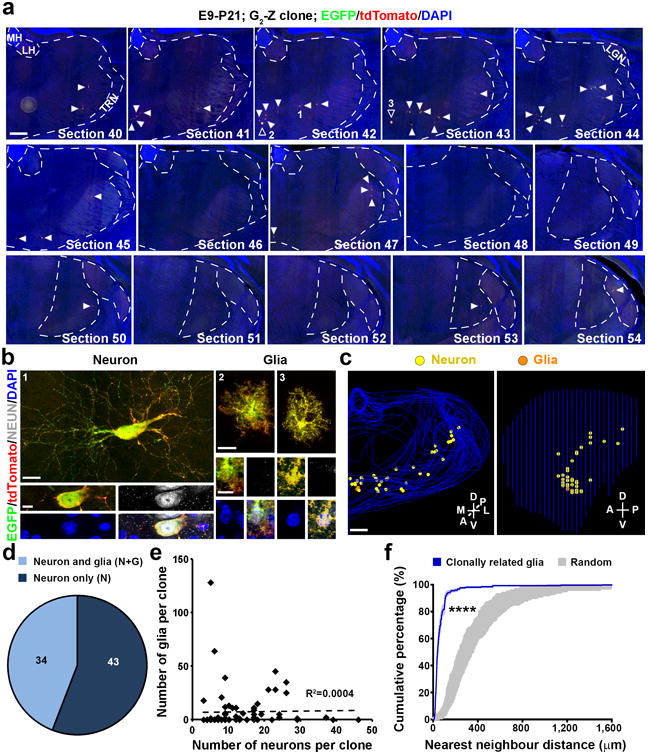
Figure 4. Spatial clustering of clonally related glial cells in the thalamus at the mature stage.

(a, b) Scanned images of a yellow G2-Z clone in a P21 brain treated with TM at E9. Consecutive sections were stained for EGFP (green) and tdTomato (red), and with DAPI (blue). Open arrowheads indicated the labeled NEUN-negative cells and arrowheads indicate the labeled neurons. High magnification images of the representative labeled neuron positive for NEUN (white) (area 1) and glial cells (areas 2 and 3) negative for NEUN are shown in b. Scale bars: 500 μm, 20 μm, 10μm, 20 μm, and 10 μm. (c) 3D reconstructed images of the thalamic hemisphere containing the clone shown in a (Front view, left; Side view, right). Scale bar: 500 μm. (d) Quantification of the fraction of P21-24 clones labeled at E9-12 containing neuron only (N) or neuron and glia (N+G). (e) No correlation between the number of neurons and the number of glia at the clonal level (n=77 clones). The broken line indicates the linear regression of the data. (f) NND analysis of MADM-labeled glial clones (n=25) in the P21-24 thalamus. Note that compared to random datasets simulated 100 times (gray), the cumulative frequency of NND of thalamic glial clones (blue) is significantly left-shifted towards shorter distances, indicating a spatial clustering. Data are presented as mean±s.e.m. ****, p=1e-15 (unpaired t-test with Welch's correction).
