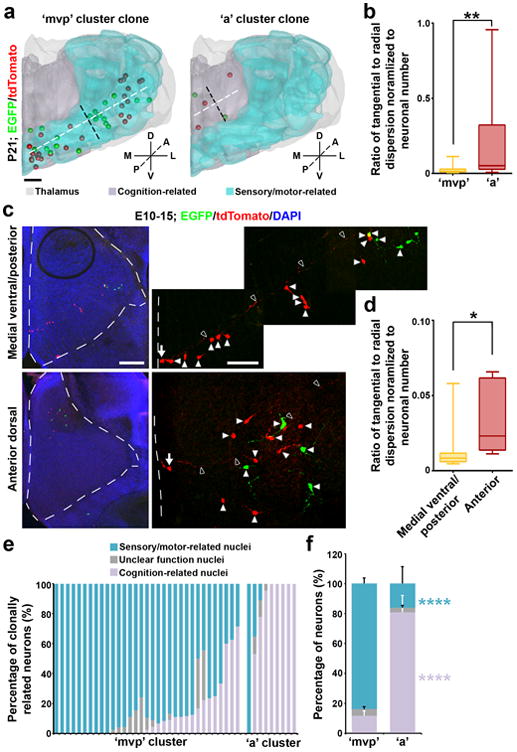
Figure 6. Distinct spatial configuration and functionality of the clonal clusters.

(a) 3D rendered images of a representative ‘mvp’ (left) or ‘a’ (right) cluster clone that predominantly occupies sensory/motor-related nuclei and cognition-related higher order nuclei, respectively. Broken lines indicate the radial (white) versus tangential (black) dispersion of the clone. Scale bar: 500 μm. (b) Quantification of the average ratio of the radial versus tangential dispersion normalized to the total number of neurons in individual clones at P21-24 (‘mvp’, n=33; ‘a’, n=9). Data are presented as median with interquartile range, and whiskers are the minimum and maximum. **, p=0.008 (Mann-Whitney test). (c) Confocal images of a representative E15 medial ventral/posterior (top) or anterior dorsal (bottom) clone labeled at E10. Broken lines indicate the contours of the thalamus. High magnification images of the clone are shown to the right. Arrows indicate the radial glial progenitors with a long radial glial fiber (open arrowheads) and arrowheads indicate the progeny. Scale bars: 200 μm and 50 μm. (d) Quantification of the average ratio of the radial versus tangential dispersion normalized to the total number of neurons in individual clones at E15-16 (‘mvp’, n=20; ‘a’, n=5). Data are presented as median with interquartile range, and whiskers are the minimum and maximum. *, p=0.012 (Mann-Whitney test). (e) Quantification of the percentage of individual ‘mvp’ and ‘a’ cluster clones located in sensory/motor-related, cognition-related, or unclear function nuclei. Each bar represents a clone. (f) Quantification of the percentage of all ‘mvp’ or ‘a’ cluster clones located in sensory/motor-related, cognition-related, or unclear function nuclei (‘mvp’: sensory/motor-related, 83.7±3.6%; cognition-related, 11.9±3.3%; unclear function, 4.4±1.6%; ‘a’: sensory/motor-related, 16.3±11.1.0%; cognition-related, 80.7±11.4%; unclear function, 3.0±1.7%). Data are presented as mean±s.e.m. ****, p=5e-05; ****, p=2.5e-05 (Mann-Whitney test).
