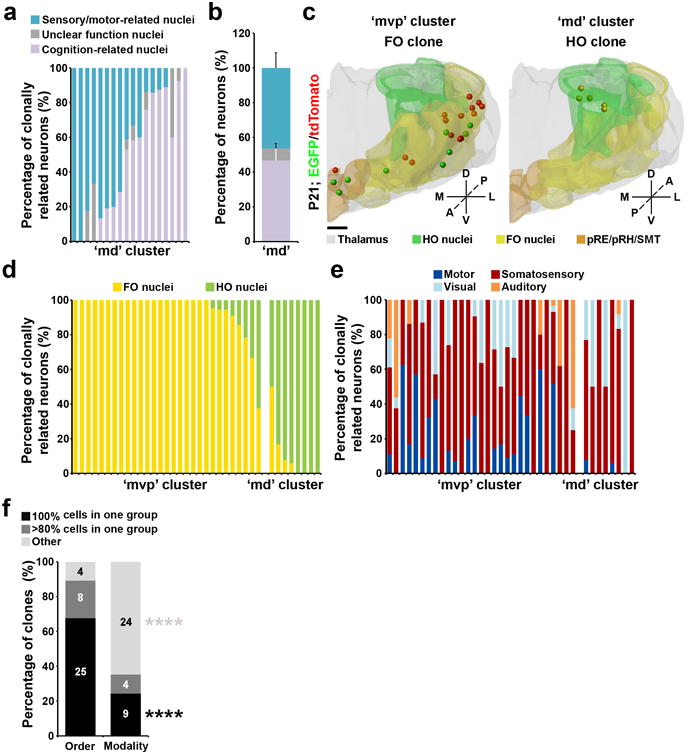
Figure 7. Clonal segregation of the FO and HO thalamic nuclei.

(a) Quantification of the percentage of individual ‘md’ cluster clones located in sensory/motor-related, cognition-related, or unclear function nuclei. Each bar represents a clone (n=18 in total). (b) Quantification of the percentage of all ‘md’ cluster clones located in sensory/motor-related, cognition-related, or unclear function nuclei (sensory/motor-related, 46.3±8.7%; cognition-related, 46.8±8.7%; unclear function, 6.8±2.8%). Data are presented as mean±s.e.m. (c) 3D rendered images of a representative ‘mvp’ (left) or ‘md’ (right) cluster clone that predominantly occupies the FO and HO nuclei, respectively. Scale bar: 500 μm.(d) Quantification of the percentage of clonally related neurons in sensory/motor-related nuclei that are in the FO or HO nuclei. Each bar represents a clone. (e) Quantification of the percentage of clonally related neurons in sensory/motor-related nuclei related to different modalities. (f) Quantification of the percentage of all clonally related neurons in sensory/motor-related nuclei according to the order (FO vs. HO) or modality (i.e. somatosensory, visual, auditory, or motor). ****, p=00019; ****, p=2e-06 (chi-square test).
