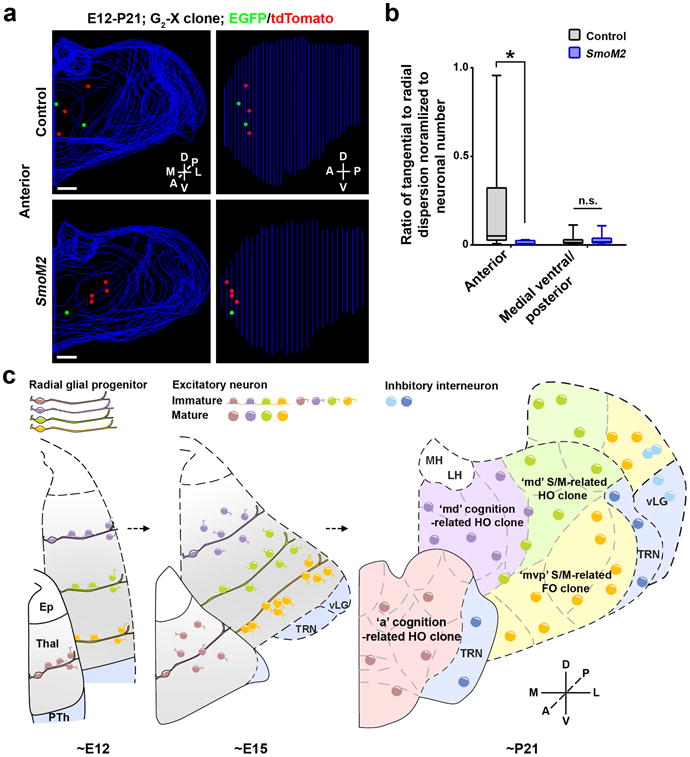
Figure 8. Shh signaling regulates the spatial distribution of thalamic clones depending on the localization.

(a) Representative 3D reconstructed images of the thalamic hemispheres containing a MADM-labeled clone in the anterior region of the wildtype control (top) and SmoM2 (bottom) mice. Scale bars: 500 μmand 500 μm. (b) Quantification of the average ratio of the radial versus tangential dispersion normalized to the total number of neurons in individual P21-24 clones in the anterior and medial ventral/posterior region of the control and SmoM2 mouse (anterior: control, n=9 clones; SmoM2, n=4 clones; p=0.02; medial ventral/posterior: control, n=33 clones; SmoM2, n=20 clones; n.s., not significant, p=0.2; Mann-Whitney test). Data are presented as median with interquartile range, and whiskers are the minimum and maximum. (c) A diagram illustrating the ontogenetic origin and organization of thalamic nuclei and function. S/M, sensory/motor.
