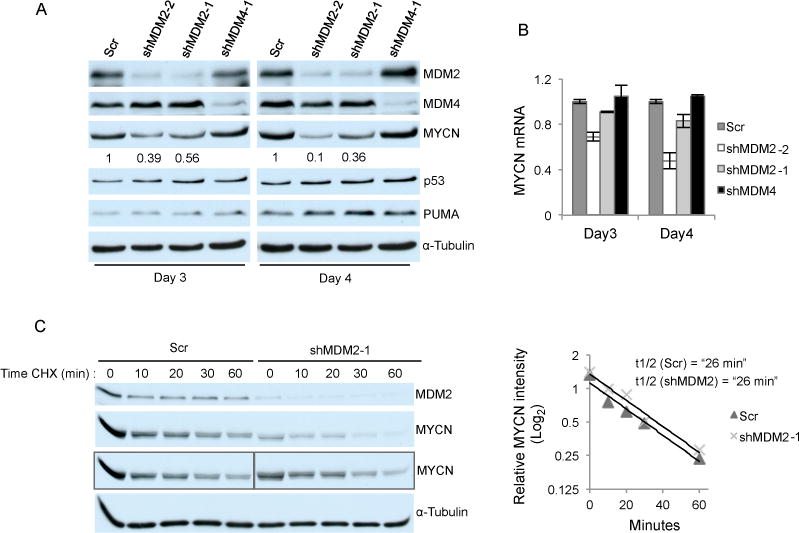
Figure 4. MDM2 regulates MYCN protein expression without altering its stability.

A. Western analysis of RB176 cells 3 or 4 days after infection with lentivirus expressing shRNA against MDM2 or MDM4 or with a scrambled control (Scr). Signal intensity of MYCN was normalized to α-tubulin. Numbers below the MYCN panel indicate relative MYCN expression upon MDM2 knockdown compared to Scr control. B. qRT-PCR analysis of the same samples plotted after normalization to GAPDH. Values and error bars denote mean and s.d. of duplicate assays. C. Western analysis of RB176 cells treated with 30 μM CHX 4 days after infection with lentivirus expressing shRNA against MDM2 and Scr (left). Boxed MYCN panels show either the same exposure (for Scr samples) or a longer exposure (for shMDM2 samples) of the western analysis in the above panel. The level of MYCN at each time point was quantified using the longer and more equivalent shMDM2 exposure, normalized to α-tubulin, and the Log2 values plotted (right), and MYCN half life determined. Data is representative of three independent experiments.
