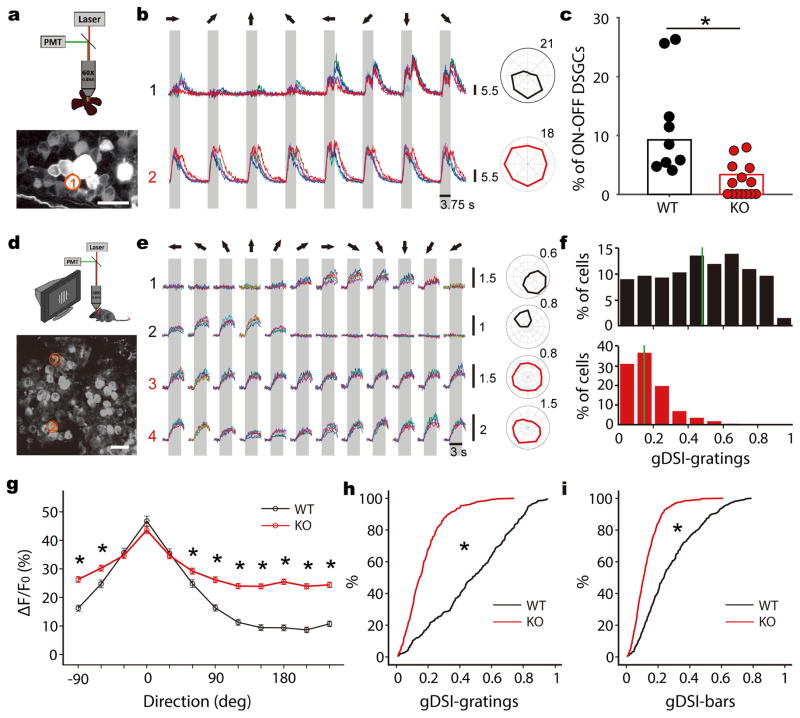
Figure 5. Genetic disruption of retinal direction selectivity reduces selectivity in the SGS.
a, A schematic of 2-photon calcium imaging of retina (top). The bottom panel shows a max-intensity projection of GCaMP6 fluorescence in an example field of view. Scale bar is 25 μm. b, Top panel shows Ca2+ signals of the RGC circled in a to the presentation of moving bars in 8 directions (different colors represent separate trials). The gray shade corresponds to the time interval in which the bar stimulus sweeps across the field of view and the arrows represent the direction of movement in relation to the polar plot on the right. This cell showed DS responses to both leading and trailing edges of the moving bars, indicating that it was an On-Off DSGC. Bottom panel shows an On-Off cell from a Vgat conditional KO mouse. c, Summary plot showing the percentages of On-Off DSGCs in WT (black, n = 60/648 cells from 9 mice) and KO (red, n = 19/566 cells from 14 mice) retinas (p <0.001, χ2 = 17.3, χ2 test). Data points represent percentages of On-Off DSGCs in individual mice. d, A schematic of 2-photon imaging of the SGS (top) and an example field of view from a WT (bottom). Scale bar is 20 μm. e, Ca2+ signals of the two neurons (1 and 2) circled in d, and of two neurons from a Vgat KO (3 and 4), in response to drifting gratings. The gray boxes mark the duration of stimulation. The moving directions are represented by arrows on top. Corresponding polar plots are shown to the right. Scale bars for the Ca2+ signals and polar plots in b and e represent the change in fluorescence from baseline (ΔF/F0). f, gDSI distribution of WT (top, black) and KO (bottom, red) cells to drifting gratings. The solid green lines indicate the median of distributions. g, Average WT (black, n = 310 cells from 5 mice) and KO (red, n = 407 from 8 mice) tuning curves to gratings after aligning each cell’s preferred direction at 0. * indicate statistically significant difference between genotypes (all p-values < 0.001, Mann-Whitney U test). Data are presented as mean ± SEM. h, Cumulative distribution of the data shown in f (p < 0.001, K-S stat = 0.61, K-S test). i, Cumulative distribution of gDSI to sweeping bars (p < 0.001, K-S stat = 0.43, K-S test).

