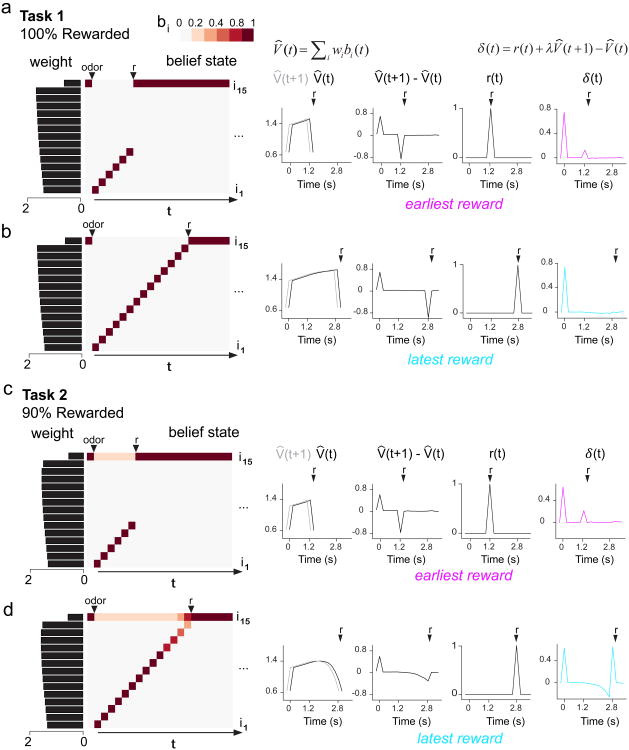
Figure 6. Belief state model shapes value signals that differ between Tasks 1 and 2, leading to opposite patterns of post-reward modulation over time.
a,b, As time elapses following odor onset in Task 1, the belief state proceeds through ISI sub-states (i1-i14) by sequentially assigning a probability of 100% to each sub-state. Later ISI sub-states accrue greater weights. Estimated value is approximated as the dot product of belief state and weight, producing a ramping value signal that increasingly suppresses δ(t) for longer ISIs. c,d, As time elapses following odor onset in Task 2, the belief state comprises a probability distribution that gradually decreases for ISI sub-states (i1-i14) and gradually increases for the ITI sub-state (i15). This produces a value signal that declines for longer ISIs, resulting in the least suppression of δ(t) for the latest ISI.

