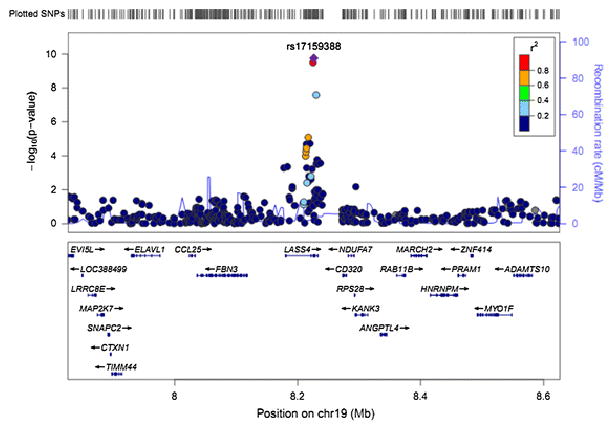
Fig. 3.

Regional plots of novel locus for 20:0. Imputed SNPs were estimated by MACH software (see URLs) using LD information from 194 Asians (including 68 CHB, 25 CHS, 84 JPT and 17 MXL) in 1000 Genome 2010.08 release as references. P values were from meta-analysis adjusting for age, gender, region and the first two principle components. The regional plots for the 400kb region centered on index SNP was generated by using LocusZoom (see URLs). The –log10 P values of SNPs were plotted against their genomic position (NCBI Build 37). The positions of genes were annotated from the UCSC Genome Browser by using GRCh37 assembly. The Index SNP is purple colored. Linkage disequilibrium (LD) is indicated by color scale in relationship to the Index SNP, with red for strong LD (r2≥0.8) and blue for lower LD.
