Figure 7.

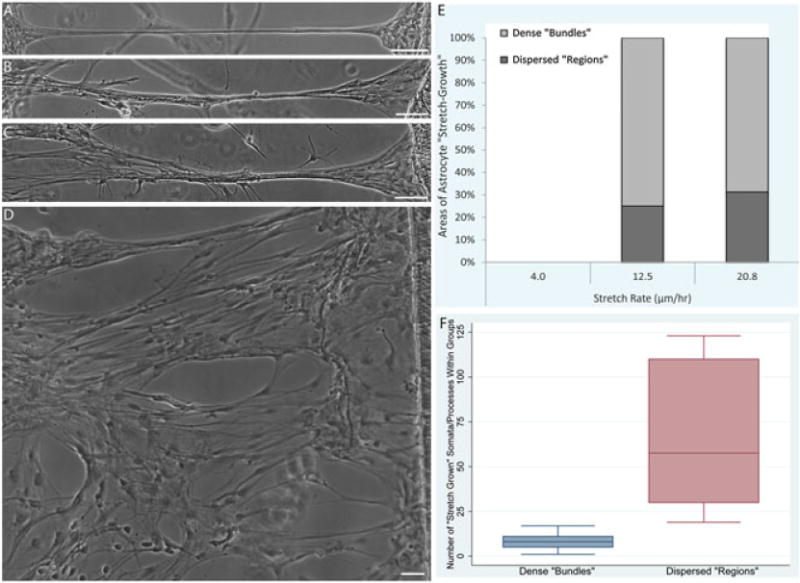
Stretched astrocytic processes may form dense bundles or present as more dispersed ‘regions’. (A–C) The majority of stretched astrocytic processes formed dense bundles consisting of multiple individual astrocyte somata/processes. (D) Larger dispersed ‘regions’ of more spread-out stretch-growth were also observed. (E) The breakdown of the incidence of stretched ‘bundles’ vs ‘regions’ was quantified, revealing a dependence on stretch rate (p < 0.05), with an absence of stretch regions at 4 μm/h and similar proportions of ‘bundles’ and ‘regions’ at 12.5 and 20.8 μm/h. (F) The number of individual astrocyte somata and processes comprising the ‘bundles’ vs ‘regions’ was also quantified, revealing that ‘bundles’ consisted of 8.08 ± 4.51 (range 1–17) astrocytes, whereas ‘regions’ consisted of 64.0 ± 39.1 (range 19–123) astrocytes. Data are presented as mean ± SD, with quantification from n = 10 ‘stretch-grown’ cultures. Scale bars =100 μm
