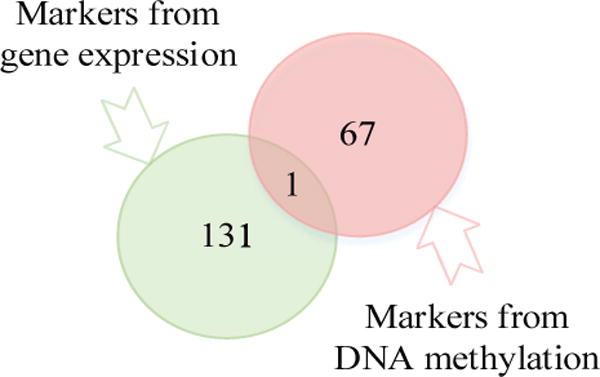
Fig. 3.

Venn diagram is shown for the feature genes from gene profile and methylation profile. In total, 199 genes were selected as feature genes that contribute most to the risk grouping in ovarian cancer. Only “NOX4” overlapped between gene expression and methylation profiles. Interestingly, the Pearson correlation between gene expression and DNA methylation level of “NOX4” is a positive value 0.21, whereas this relationship is usually assumed to be negative. To some degree, although not considered currently, the DNA methylation profile and RNA expression profile of the same gene are inevitably correlated due to biological mechanism, the fact that only one gene’s DNA methylation and RNA expression profile are both selected indicates also the relatively small “between profile redundancy” in the selected gene marks, which should facilitate the classification performance.
