
Fig. 5.
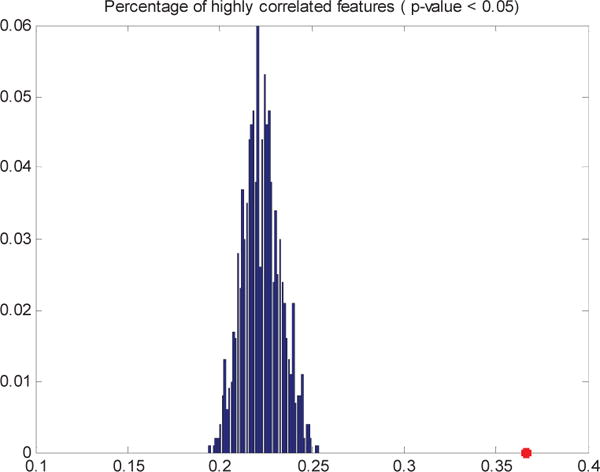
Comparison of percent of high correlation feature pairs in 1000 sets of randomly selected 200 features vs. GIREN selected features. The histogram in blue is the percent of highly correlated features based on 1000 sets of randomly selected 200 features. The star in red (36.7%) indicates the percent of highly correlated feature pairs in GIREN selected 200 features.