
Fig. 6.
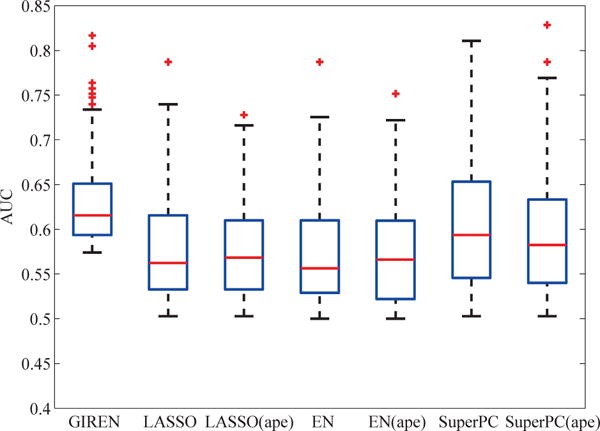
Progression prediction performance based on the gene list selected by GIREN, LASSO, Elastic Net and SuperPC with original gene measurement or average pathway expression in ovarian cancer GIREN achieved the best performance among the 7 tested methods in term of the “area under curve” (AUC), indicating an improved accuracy of the proposed method in predicting the risk group of the ovarian cancer patients. 79 patients were involved in this test, and ten times of 3-fold cross validation was conducted to evaluate the performance. For LASSO method, the weight coefficient α is set to be 0.31 by cross-validation. For Elastic Net method, the weight coefficient α and λ were set to be 0.4 and 0.6 respectively by cross-validation. For GIREN, the weight coefficients α, λ, and γ were set to be 0.4, 0.4 and 0.08, respectively according to cross-validation.