Fig 7.
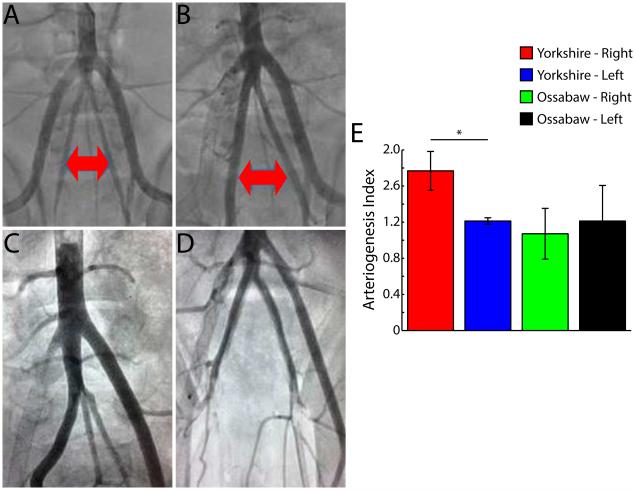
Arteriogenesis of ipsilateral internal iliac artery (IIA). A, B, Pre-occlusion and 5 week post-occlusion aortagrams, respectively, in Yorkshire swine. Red arrows identify IIAs. C, Representative aortogram in Yorkshire swine at 5 weeks. Note difference in size of right (ischemic side) and left (non-ischemic side) IIAs D, Representative aortogram in Ossawbaw swine at 5 weeks. E, Arteriogenesis index (ratio of diameters at pre-occlusion and 5 week post-occlusion) in Yorskhire and Ossawbaw swine. Data are means ± SD. *P < 0.01.

