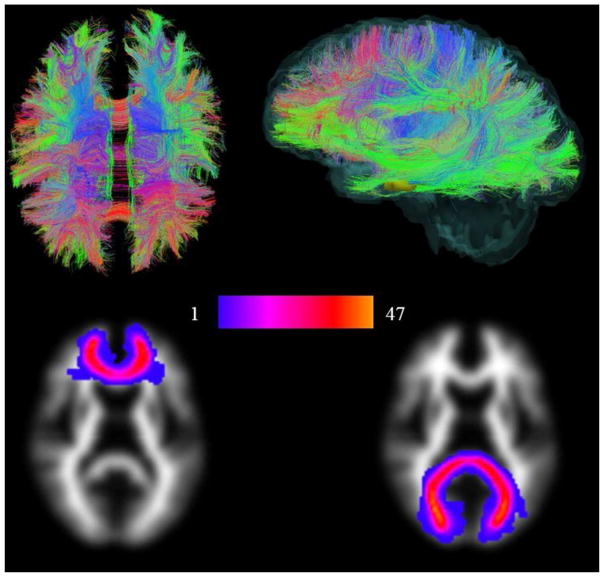
Figure 1.
Whole brain white matter tractography and group maps. The first row shows maps of whole brain white matter structure from a representative patient. White matter tracts running predominantly anterior/posterior are coloured green, superior/inferior blue and right/left red. The second row shows group maps (all patients superimposed on each other) of two major tracts, the genu and splenium of corpus callosum for all 47 patients. Note the close correspondence of these tracts, indicated by the lighter red/yellow colours, which allows the integrity of the same structure to be measured across the cohort.

