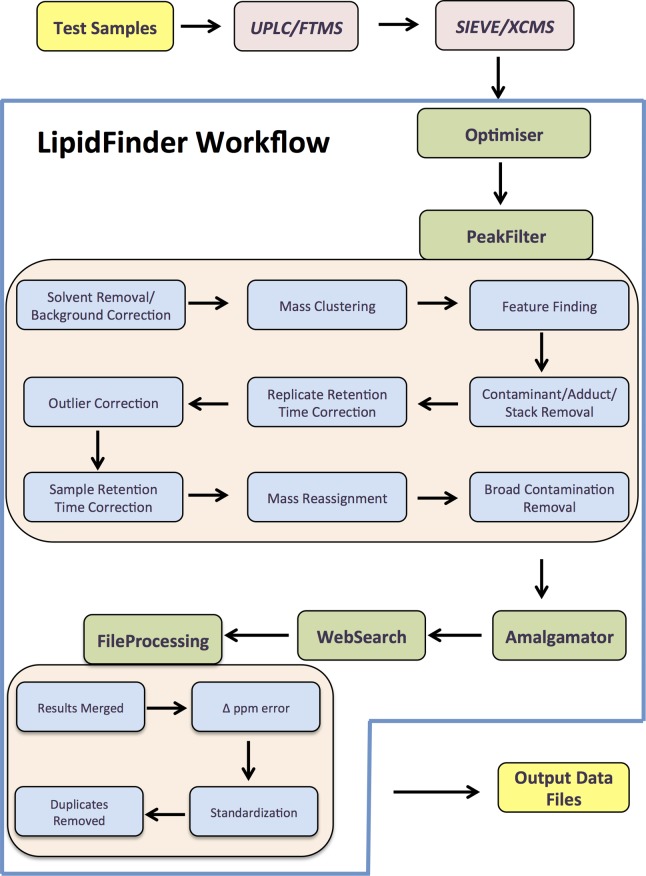
Figure 1. Schematic of the LipidFinder data processing workflow (using SIEVE).
Data is first analyzed using UPLC/FTMS, and SIEVE is then fed into the LipidFinder workflow, which incorporates Optimiser, PeakFilter, Amalgamator, WebSearch, and FileProcessing. Data files that retain m/z, peak area, retention time, and putative identifications are outputted at the end.

