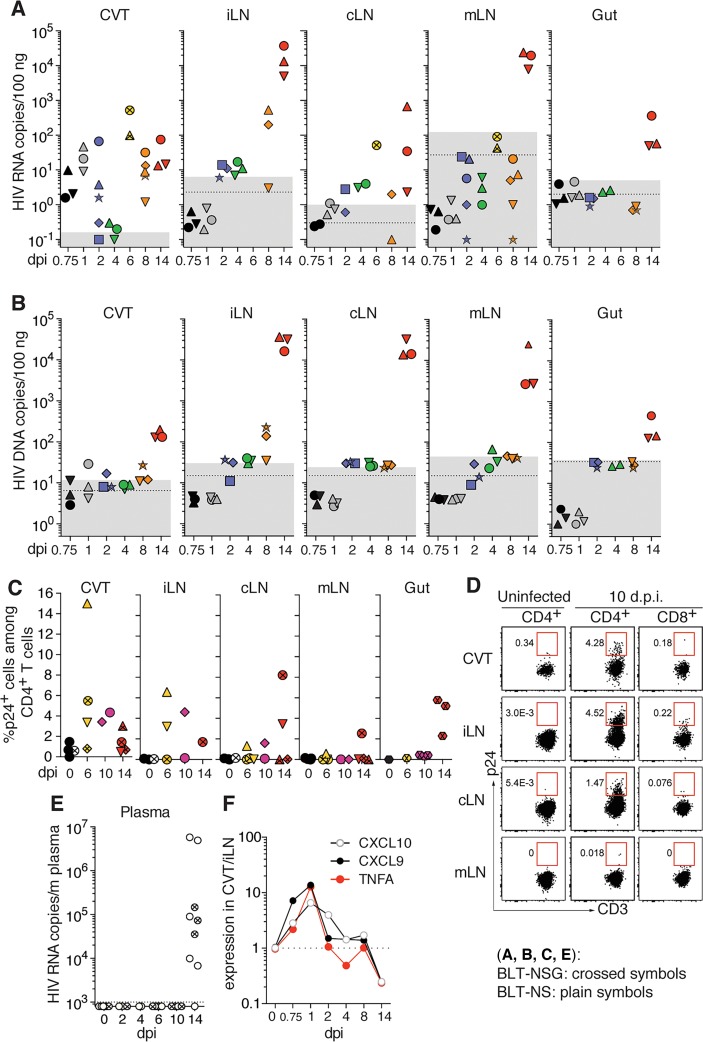
Figure 1. HIV dissemination in humanized BLT mice following intravaginal (IVAG) infection.
BLT-NOD-scid (NS, plain symbols) and BLT-NOD-scid IL2Rγ–/– (NSG, crossed symbols) mice were sacrificed at different days postinfection (dpi) with 1 × 10⁵ 50% tissue culture infectious dose (TCID50) R5-tropic HIV strain JRCSF (HIVJRCSF) IVAG (n = 2–4 per time point). The presence of (A) viral RNA by RT-qPCR, (B) DNA by qPCR, or (C) infected T cells by p24+ flow cytometry, was analyzed in different tissues. Mice from which tissues were harvested on the same dpi are shown with the same color and each mouse within one color group is represented by a different symbol. Dotted line: mean value of tissue from 3 to 5 uninfected mice; gray box: ± 2 SD of mean value of uninfected mice. (D) Representative flow cytometry plots showing the percentage of HIV p24+ human CD4+ T cells in tissues of uninfected (left panels) and infected (middle panels) BLT-NS mice 10 dpi. Human CD8+ T cells (right panels) were used as negative controls. (E) HIV RNA in plasma detected by RT-qPCR. Dotted line: limit of sensitivity of the assay corresponding to 3 copies/μl HIV RNA (n = 2–7 per time point). (F) Ratio of human TNFA, CXCL9, and CXCL10 expression in CVT compared to iLNs at different dpi as measured by qPCR on tissue cDNA using a mean of 3 animals per group. CVT, cervico-vaginal tissue; LNs, lymph nodes; iLNs, iliac LNs; cLNs, cervical LNs; mLNs, mesenteric LNs.

