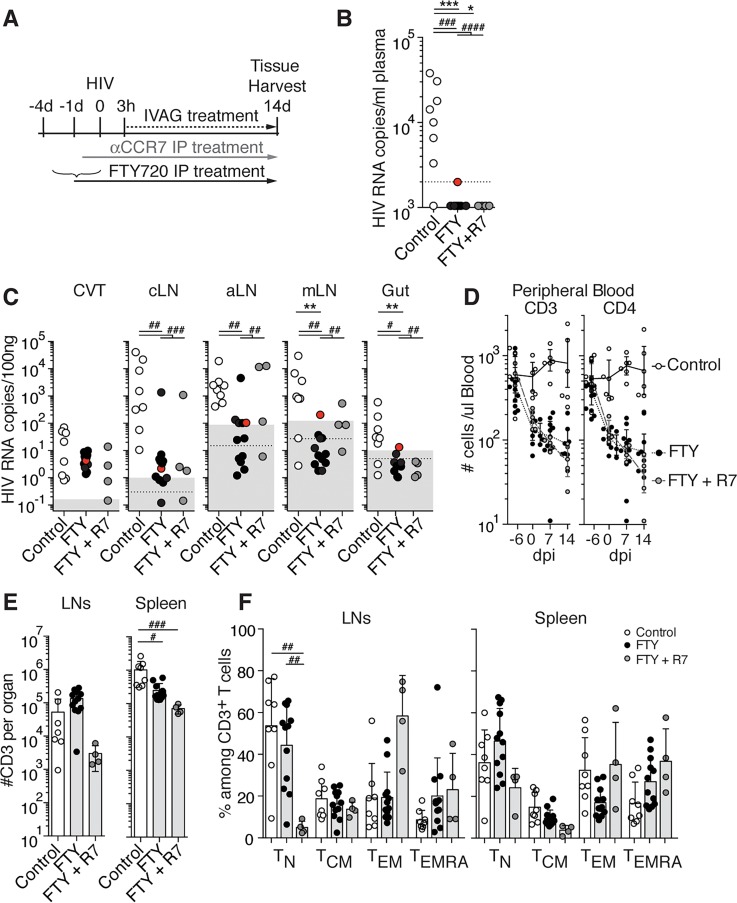
Figure 3. FTY720 treatment interferes with HIV spread to the lymph nodes (LNs) and prevents infection from leaving LNs.
(A) Scheme of the experimental treatment. BLT-NSG mice received PBS (control) or FTY720 daily i.p. starting 4 days prior to or on the day of intravaginal (IVAG) infection, and received PBS or FTY720 daily IVAG starting 3 hours postinfection. CCR7 mAb (αCCR7) i.p. and IVAG treatments were performed as described in Figure 2. Presence of HIV RNA in plasma (B) and tissues (C) at 14 days postinfection (dpi) of control (open circles, n = 8), FTY720-treated (FTY, black circles, n = 12), and FTY720+CCR7 mAb–treated (FTY+R7, gray circles, n = 4) mice. Each circle in B–F represents 1 mouse. The FTY720-treated mouse with borderline viremia is highlighted in red. Dotted line: limit of sensitivity of the assay; gray box: ± 2 SD of the mean of 3 to 5 uninfected animals. (D) Numbers of human CD3+ and CD4+ T cells in peripheral blood, (E) numbers of human CD3+ in LNs and spleen, and (F) percentages of TN, TCM, TEM, TEMRA in LNs and spleen of control, FTY-treated, and FTY+R7–treated mice. Bars in E and F represent mean + SD. CVT, cervico-vaginal tissue; cLNs, cervical LNs; aLNs, axillary LNs; mLNs, mesenteric LNs; TN, naive T cells; TCM, central memory T cells; TEM, effector memory T cells; TEMRA, effector memory T cells reexpressing CD45RA. Kruskal-Wallis test was used to perform statistical comparisons of mean percentages and viral load (#P < 0.05, ##P < 0.01, ###P < 0.001, ####P < 0.0001), and Fisher exact test was used to perform statistical comparisons of the number of viremic and nonviremic tissues in treated versus untreated mice (*P < 0.05, **P < 0.01, ***P < 0.001).

