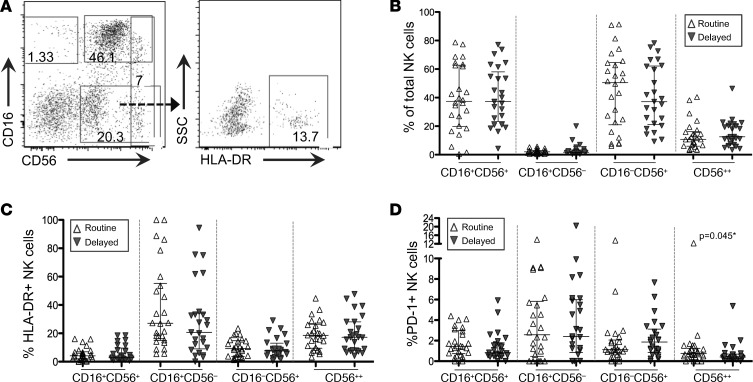
Figure 5. NK cell phenotype and activation in routine and delayed BCG-vaccinated HIV-exposed infants at 8 weeks of age.
(A) Representative flow plot depicting CD56+ and CD16+ NK cells in PBMCs, which were previously gated on singlets, live, and Lin– populations (CD3–CD19–CD14–). (B) Graphs depicting the overall NK cell phenotypic distribution in routine (white triangles; n = 26) or delayed (gray inverted triangles; n = 25) BCG-vaccinated infants at 8 weeks of age and (C) activation status of each subset, as measured by the percentage of HLA-DR–expressing NK cells. Only infants in the routine arm received vaccination at this point, while the delayed arm was unvaccinated. Lines depict the median of each group; whiskers represent the interquartile range. Statistics were generated using a Mann-Whitney test for nonparametric data.

