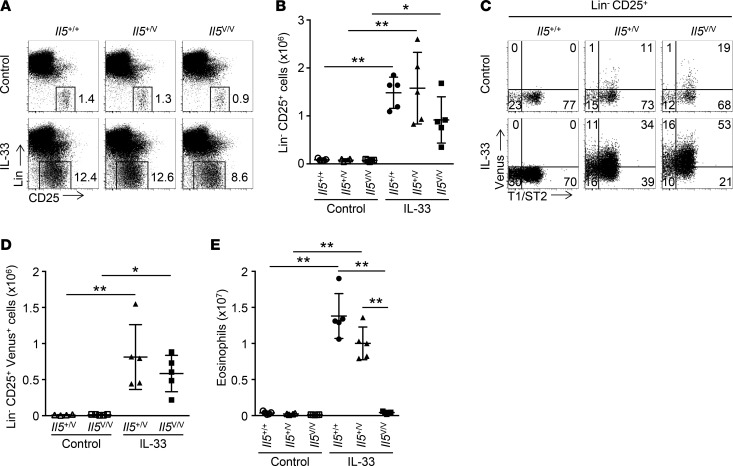
Figure 1. Expansion of IL-5–producing ILC2s and IL-5–dependent eosinophilia in the lung induced by prolonged IL-33 administration.
(A) Representative flow cytometric analysis of nongranulocytes (refer to Supplemental Figure 1A for flow cytometric gating) in lungs from Il5+/+, Il5+/V, or Il5V/V mice (n = 4 or 5 per group), treated with PBS (control) or IL-33 weekly 3 times (on days 0, 7, and 14), and analyzed on day 21. Cells are shown with the expression of lineage (Lin) and CD25. Numbers show percentages of the gated cell populations. (B) Numbers of Lin–CD25+ cells. Cell numbers were calculated based on the analysis from A. (C) Representative flow cytometric analysis of Lin–CD25+ cells derived from A. Cells are shown with the expression of Venus and T1/ST2. (D) Numbers of Lin–CD25+Venus+ cells. Numbers were calculated based on C. (E) Numbers of eosinophils. Cell numbers were calculated based on Supplemental Figure 1E. Graph data are shown as means ± SD. P values were calculated using one-way ANOVA with Bonferroni test. Asterisks indicate statistical significance (**P < 0.01).

