
Figure 1. Distinction between I Ks and I Kr .
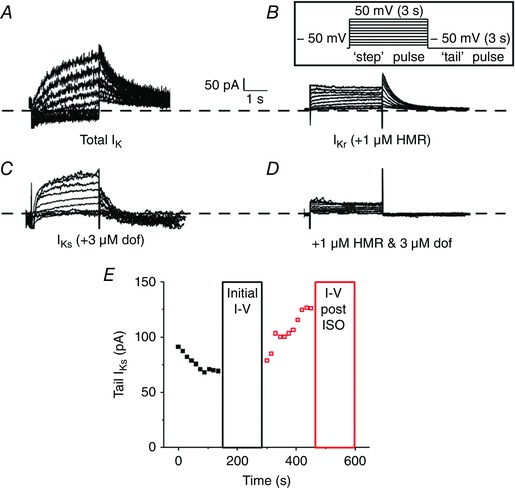
A–C, representative traces of whole‐cell total I K (A), I Kr (B) and I Ks (C) measured from isolated rabbit ventricular myocytes. Currents were recorded by applying step‐like pulses (inset) from −40 to 50 mV in 10 mV increments for 3 s, followed by a ‘tail’ pulse to −50 mV for 3 s. The inter‐pulse interval was 15 s. D, representative traces of whole‐cell currents recorded with high pipette [Ca2+] from the same cell as in C after perfusion of 1 μm HMR to show selective I Ks block. E, an exemplar time course of tail I Ks monitored before (black) and after (red) perfusion of ISO when pipette [Ca2+] was high.