
Figure 6. [Ca2+]i slows deactivation of I Ks .
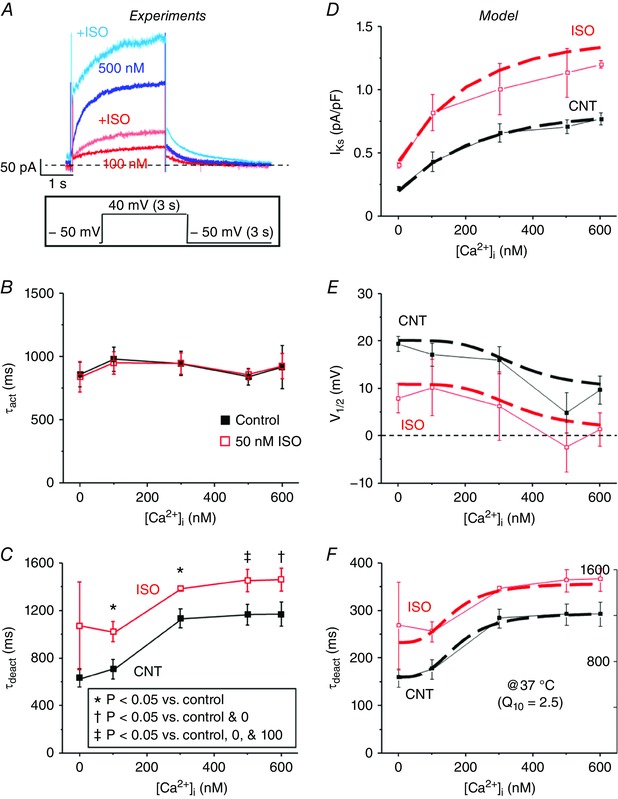
A, representative traces of I Ks recorded using pipette solutions with free [Ca2+]i of 100 and 500 nm before (100 nm, red; 500 nm, blue) and after (100 nm, light red; 500 nm, light blue) ISO are overlaid. I Ks was recorded using the same V m protocol as in Fig. 3 C by applying a step pulse from −50 to 40 mV for 3 s, followed by a tail pulse to −50 mV for 3 s. B, τact of I Ks was fitted to a single exponential during the step pulse to 40 mV and is plotted as a function of free [Ca2+]i in the pipette solution before (black) and after (red) ISO perfusion for 0, 100, 300, 500, and 600 nm [Ca2+]i. C, the decay in tail I Ks following the 40 mV step‐pulse was fitted to a single exponential to determine τdeact and is plotted as a function of free [Ca2+]i in the pipette solution before and after ISO perfusion for 0, 100, 300, 500, and 600 nm [Ca2+]i. The n values for each situation are the same as in Fig. 5. The [Ca2+]i dependence and ISO effects (50 nm) on I Ks (D), V 1/2, (E) and τdeact (F) were incorporated into a model of I Ks based on the experimental data and was scaled to 37 °C. Simulated I Ks (dashed lines) are shown overlaid with experimental results (solid lines).