
Figure 7. Ca2+ dependence of HMR‐sensitive I Ks activated during AP waveform.
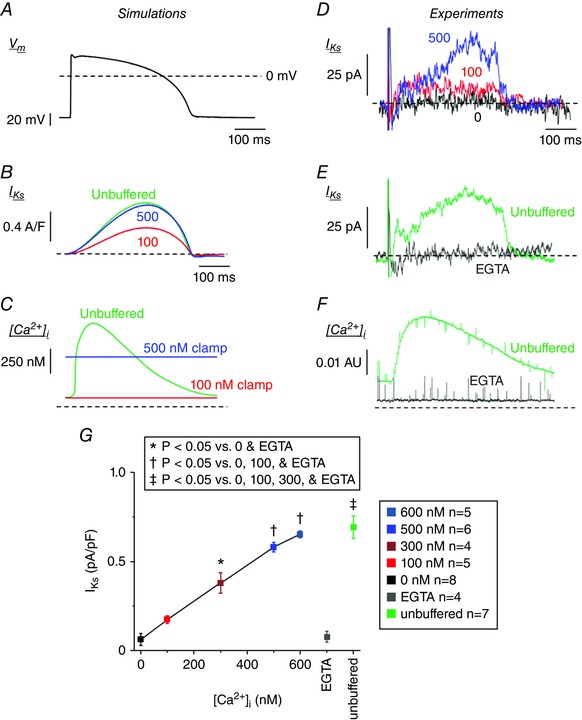
A, rabbit ventricular AP waveform used for AP simulations and to record HMR‐1556‐sensitive I Ks at 35–37°C. B and C, time courses of I Ks (B) and CaT (C) during 1 Hz computational simulations using the AP waveform as in Fig. 7 A are shown with [Ca2+]i clamped at 100 (red) and 500 nm (blue), or unbuffered (Free CaT, green). D, representative whole‐cell current subtracted HMR‐sensitive (1 μm) I Ks traces are overlaid for cells recorded with free [Ca2+]i of 0 (black), 100 (red) and 500 nm (blue). E, representative whole‐cell current subtracted HMR‐sensitive (1 μm) I Ks traces are overlaid for cells recorded (using the AP waveform in Fig. 7 A as the V m command) with [Ca2+]i heavily buffered by 10 mm EGTA (grey) or unbuffered (green). F, the corresponding Ca2+ signal is shown. Note that free [Ca2+]i is reduced at baseline and during the AP when buffered, and a normal CaT is present when unbuffered. G, the peak I Ks during ventricular AP waveform recordings are plotted for cells recorded using a pipette solution containing free [Ca2+]i of 0, 100, 300, 500, or 600 nm, and buffered with EGTA or unbuffered.