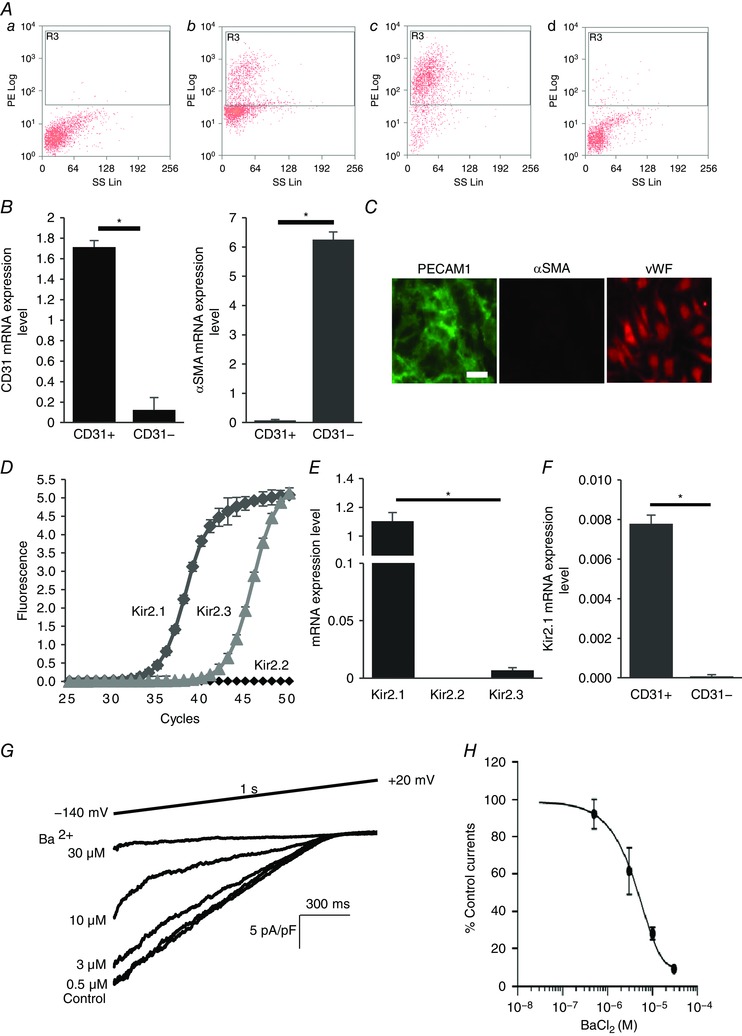
Figure 1. Kir2.1 functional expression in mouse mesenteric arterial endothelial cells.

A, mouse mesenteric arterial endothelial cells are isolated by magnetic cell sorter (AutoMACs, Miltenyi Biotech) with polyclonal anti‐mouse platelet endothelial cell adhesion molecule 1 (PECAM1) IgG conjugated to magnetic beads. The purity of the isolated endothelial cells is identified by flow cytometry using PE‐conjugated monoclonal anti‐mouse PECAM1 IgG: a, unstained digested cells; b, PECAM1 positive cells before magnetic cell sorting; c, PECAM1 positive cells (endothelial cells) after magnetic cell sorting (∼93% purity); d, PECAM1 negative cells after magnetic cell sorting. B, real‐time PCR confirmation of isolated pure endothelial cells from the murine mesenteric arterial bed. mRNA levels of endothelial cell marker (PECAM1, CD31) and smooth muscle cell marker smooth muscle α‐actin (αSMA) were normalized by GAPDH (CD31+, purified endothelial cells; CD31−, residual cells; n = 4, * P < 0.05). C, further identification of freshly isolated microvascular endothelial cells with immunofluorescence staining for the smooth muscle cell marker αSMA (negative control, red) and the endothelial cell marker PECAM1 (CD31, green). Another endothelial marker, von Willebrand factor (vWF, red), stained in different sets of the experiment (scale bar = 100 μm). D, amplification plots of qPCR for Kir2.1, 2.2 and 2.3 from freshly isolated cells. E, mRNA expression levels of Kir2.1, 2.2 and 2.3 are compared to Kir2.1 expression levels, after normalizing to GAPDH (n = 3 experiments from 15 mice, * P < 0.05). F, Kir2.1 mRNA expression levels in purified endothelial cells (CD31+) and residual cells (CD31−) (n = 4, * P < 0.05). G, representative whole‐cell patch clamp recording of a dose–response curve for Ba2+ (0.5, 3, 10, and 30 μm) from WT mice‐derived mesenteric arterial endothelial cells. A ramp protocol (−140 to +20 mV) and a high K+ bath (E K = +0.91 mV) were used to optimize Kir currents. The holding potential in all experiments was −60 mV. H, inhibitory dose–response curve elicited by Ba2+ and derived from electrophysiological recording at −100 mV. IC50 was calculated from the curve (n = 12 from 4 different experiments). [Colour figure can be viewed at wileyonlinelibrary.com]
