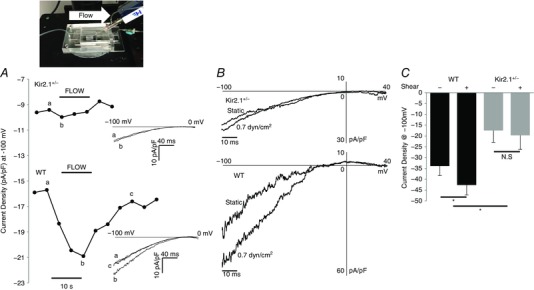
Figure 3. Reduction of flow‐stimulated Kir current in endothelial cells of Kir2.1+/− mice.

Inset, installed MIF device for electrophysiology recordings as it appears on the microscope head stage. A, time course of flow‐activated Kir current from Kir2.1+/− (upper trace) and WT (lower trace) showing current densities before, during and after flow. The time course is representative of individual data points taken from the ramp protocols (−100 to 0 mV) at −100 mV shown to the right of each time course. Current traces at time points designated by lower case letters (a, b, c) are shown as insets to the panel. B, representative recording of flow stimulated Kir currents in freshly isolated ECs from Kir2.1+/− and WT mouse mesenteric arteries. C, average Kir current density at −100 mV in the freshly isolated ECs from WT and Kir2.1+/− mouse mesenteric arteries (WT, n = 5 cells from 3 mice; Kir2.1+/−, n = 5 cells from 2 mice, * P < 0.05).
