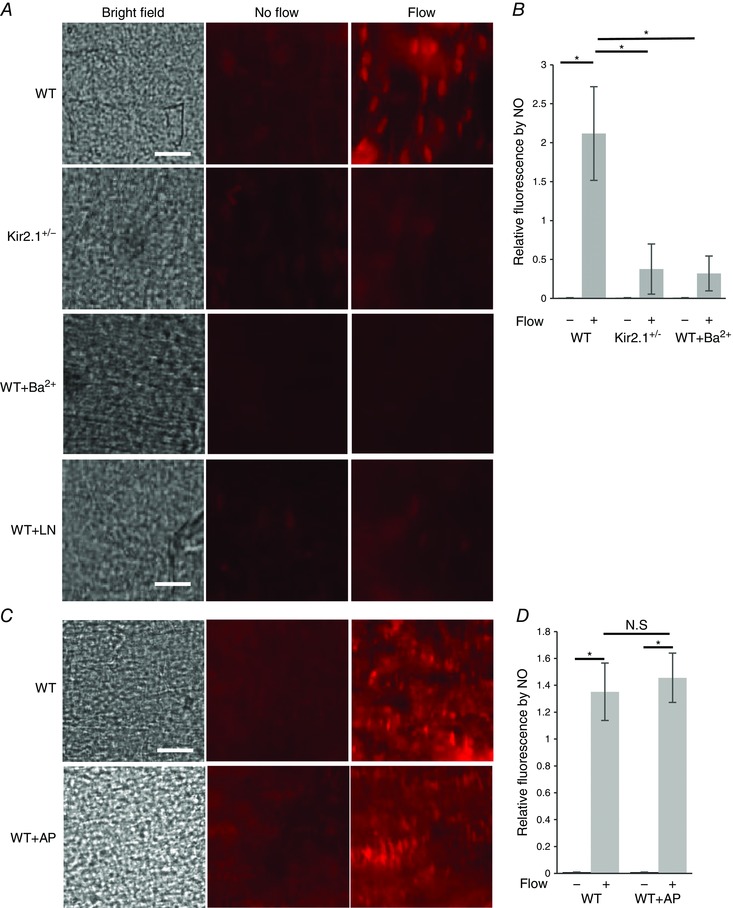
Figure 11. Kir2.1, but not SK, controls flow‐induced nitric oxide production.

A, images of NO‐specific fluorescence in response to flow in WT and Kir2.1+/− mesenteric arteries: left panels show the inner surface of the arteries in bright field, middle panels show NO‐specific fluorescence stained by DAR4M in arteries not exposed to flow, right panels show NO‐specific fluorescence in arteries exposed to flow generated by a pressure gradient of Δ60 cmH2O for 30 min with or without Ba2+ (30 μm) or l‐NAME (100 μm) (scale = 50 μm). B, quantification of NO‐specific fluorescence in the same arteries normalized to ‘No flow’ control (n = 6 arteries per condition, * P < 0.05). C, images of NO specific fluorescence of WT arteries maintained under static conditions (middle panels) or exposed to 30 min of flow (right panels) with or without application of apamin (20 nm). D, quantification of NO‐specific fluorescence in the same arteries (n = 5 arteries per condition, * P < 0.05). [Colour figure can be viewed at wileyonlinelibrary.com]
