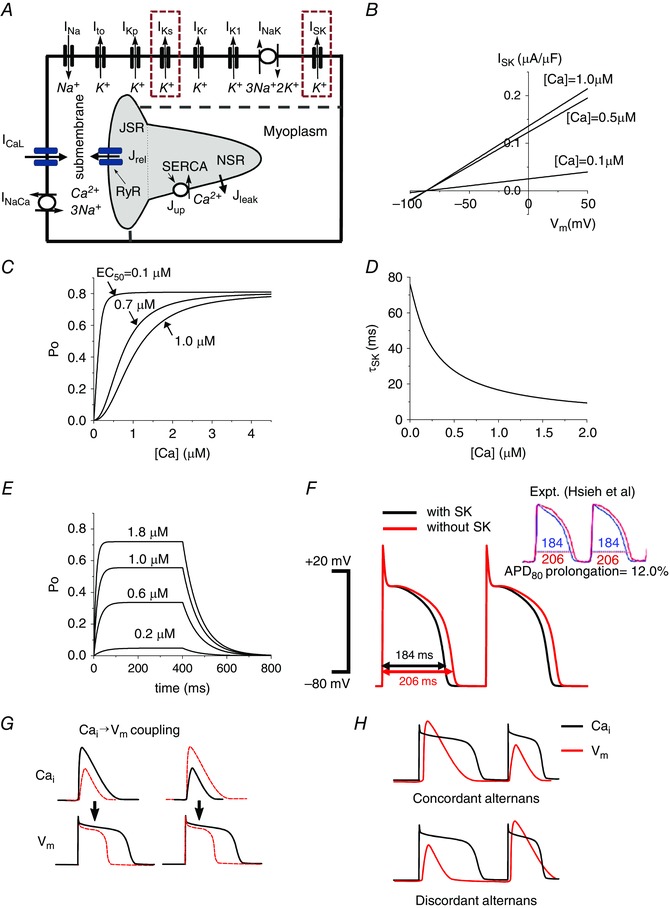
Figure 1. Physiologically detailed mathematical model.

A, schematic diagram of the currents and fluxes that regulate V m dynamics and cycling. B, model of the SK channel: I SK vs. V m when [Ca2+] is 0.1, 0.5 and 1.0 μm. C, channel open probability as a function of intracellular Ca2+. D, inverse relationship between intracellular Ca2+ and the SK time constant (τSK2). E, open probability (P o) vs. time when various test [Ca2+] pulses are applied. [Ca2+] was changed from 0 μm to test [Ca2+] for 400 ms, and then changed to 0 μm. F, transmembrane voltage plotted against time demonstrating the decrease in APD from baseline (red) to inclusion of the SK channel (black). When g sk = 0.8 μS μF−1 and EC50 = 0.7 μm are chosen, the model shows 12% difference of APDs, which was shown by Hsieh et al. experimentally (Hsueh et al. 2013), by copyright permission of the American Heart Association, Inc. G, positive and negative →V m coupling. H, electromechanically concordant (large APD→large Ca2+ transient, small APD→small Ca2+ transient) alternans and discordant (large APD→small Ca2+ transient, small APD→large Ca2+ transient) alternans.
