
Figure 3. Effects of the maximum conductance and Ca2+ affinity of I SK .
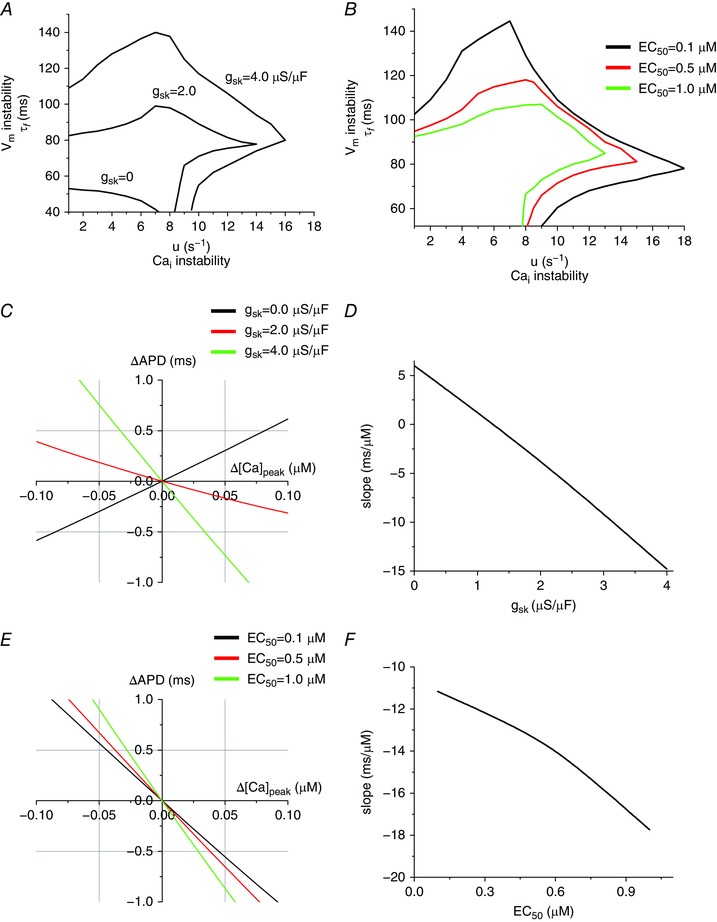
A, stability boundaries plotted for three g sk, with values of 0, 2.0 and 4.0 μS μF−1. B, stability boundaries plotted for three EC50 values of 1.0, 0.5 and 0.1 μm corresponding to the black, red and green curves, respectively. C, the slope of ΔAPD vs. Δ[Ca2+]peak indicates the →V m coupling. When g sk = 0 μS μF−1, the →V m coupling is positive, while when g sk = 4.0 μS μF−1, the →V m coupling is negative. EC50 is 0.7 μm. D, slope (ΔAPD/Δ[Ca2+]peak) vs. g sk. E, ΔAPD vs. Δ[Ca2+]peak when EC50 is varied. g sk is 4.0 μS μF−1. F, slope (ΔAPD/Δ[Ca2+]peak) vs. EC50.