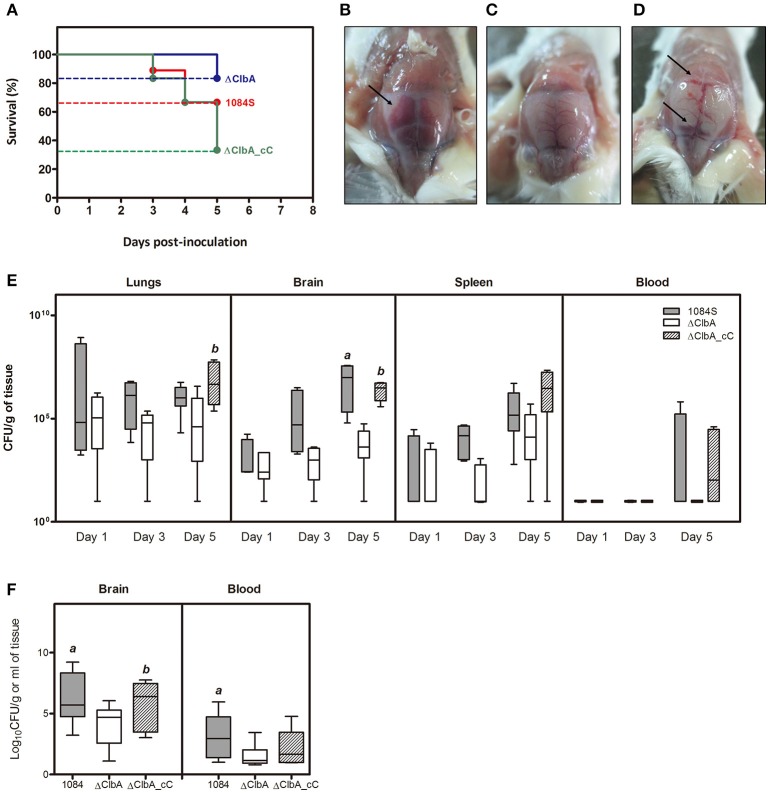
Figure 4.
Meningitis development following intranasal or intravenous inoculation of K. pneumoniae 1084S. Groups of 8-wk old BALB/c male mice were intranasally inoculated with 1 × 10⁶ CFU of K. pneumoniae 1084S, ΔClbA, or ΔClbA_cC. (A) The 5-day survival rates of 1084S- (n = 9; red line), ΔClbA- (n = 6; blue line), or ΔClbA_cC-inoculated (n = 12; green line) mice determined by Kaplan-Meier analysis using Prism5 (GraphPad) are shown. At the 5th day post-inoculation, the infected mice which survived the experimental period were sacrificed. Representative images of the brain in the mice infected with K. pneumoniae 1084S (B), ΔClbA (C), or ΔClbA_cC (D) are shown. Arrows indicate subarachnoid hemorrhage. (E) Three to five mice were sacrificed at the day 1, 3, and 5 post-intranasal-inoculation. The lungs, brain, spleen, and blood were retrieved and homogenized for the determination of bacterial loads for the 1084S- (dark gray), ΔClbA- (white), and ΔClbA_cC- (slash) group. (F) Bacterial loads in the brain and blood were determined at 24 h after intravenous inoculation with 1 × 10⁶ CFU of K. pneumoniae 1084S (dark gray), ΔClbA (white), or ΔClbA_cC (slash). CFU per gram of tissues is presented in a box and whisker plot. The edges of each box are the 25th and 75th percentiles, and the middle is the median. Lower case letter “a” and “b” represents statistical significance of CFUg−1, p < 0.05 (one-tailed) determined by Mann-Whitney test, between 1084S/ΔClbA and ΔClbA/ΔClbA_cC, respectively.

