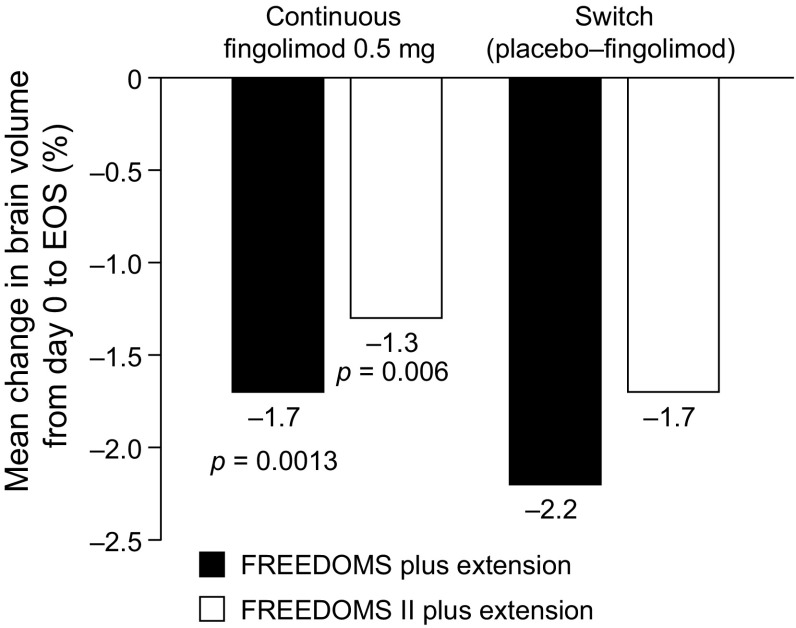
Fig. 1.
Mean percentage change in BV (measured with SIENA) from day 0 to EOS in FREEDOMS, FREEDOMS II and their extensions [27, 29]. All p values are versus the respective extension study switch group. BV brain volume, EOS end of study, SIENA Structural Image Evaluation, using Normalization, of Atrophy

