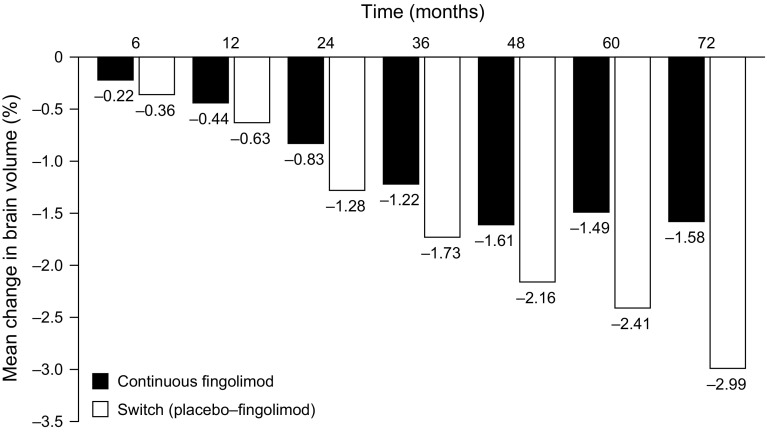
Fig. 3.
Mean percentage change in BV (measured with SIENA) from baseline (core FREEDOMS and FREEDOMS II) in the continuous and switched groups of patients participating in the LONGTERMS extension study [34]. In the switched groups, patients were switched from placebo to fingolimod at month 24. BV brain volume, SIENA Structural Image Evaluation, using Normalization, of Atrophy

