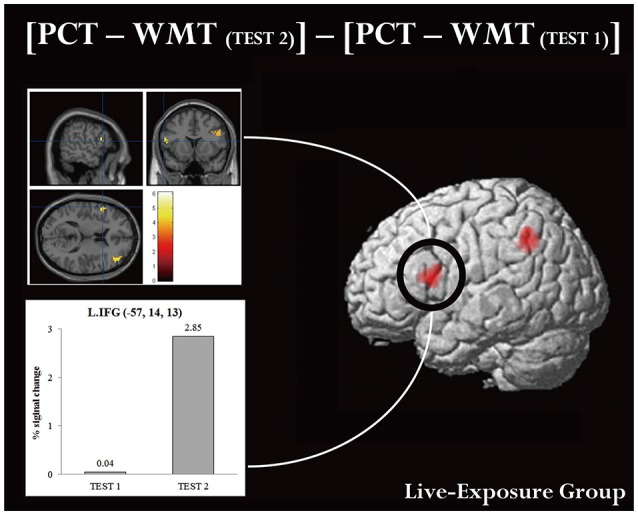
Figure 3.

Brain activation in MNI space and ROI analysis for the left IFG. An ROI analysis was conducted in the left IFG, which is assumed to be involved in the processing of language. (Upper panel) cortical activation in [PCT – WMT(TEST 2)] – [PCT – WMT (TEST 1)] condition. (Lower panel) histograms for averaged maximum amplitudes of fitted hemodynamic responses at the local maximum in the left IFG. Each bar represents signal changes for TEST 1 and TEST 2, respectively. Note that signal changes in TEST 2 were significantly larger than in TEST 1 [t(17) = −4.88, p < 0.001, d = −0.89].
