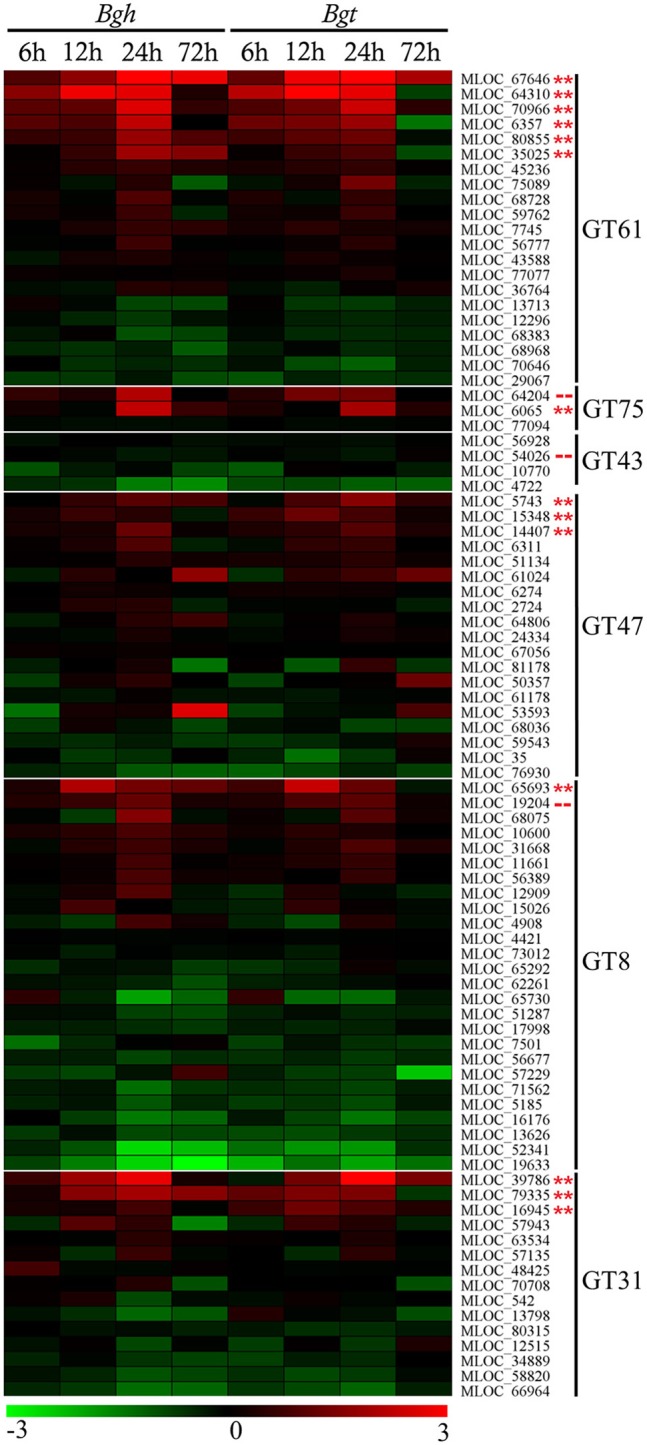
Figure 2.

Microarray transcript profiling of the glycosyltransferase gene families in barley leaves infected with adapted Blumeria graminis f. sp. hordei (Bgh) and non-adapted Blumeria graminis f. sp. tritici (Bgt) fungi at different time points. The scale of this heatmap is given as standardized fold-changes (log2) of infected tissue relative to the uninfected control with a range from −3 (green) to 3 (red). Individual constructs with a double asterisk (**) displayed a statistically significant (p < 0.05, paired t-test, unpaired t-test and ANOVA) increase in transcript levels, while constructs with a dashed line (- -) were selected for further analysis on the basis of predicted function and basal expression levels. A list of the genes with their corresponding microarray probeset ID is available in Table S1.
