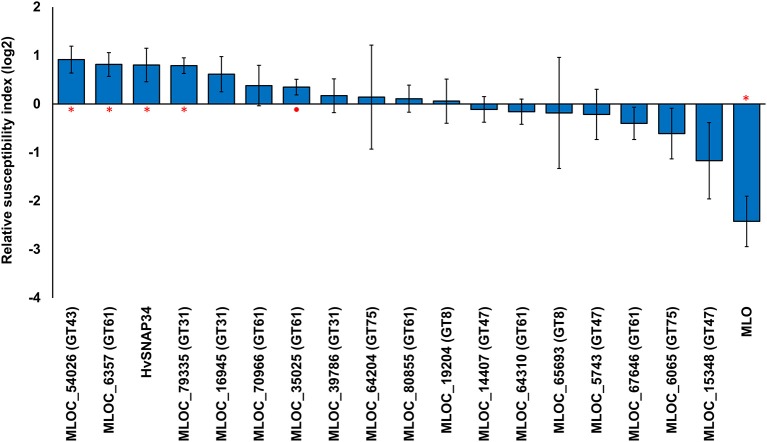
Figure 3.
Transient induced gene silencing of candidate genes and the changes in susceptibility to fungal penetration. The relative susceptibility index (RSI) was calculated as fold-changes (log2) normalized against the empty vector control. Individual constructs with an asterisk (*) displayed a statistically significant (p < 0.05, one sample t-test) difference compared to the empty vector construct, while constructs with a solid circle (•) were close to the statistical cut-off (0.05 < p < 0.1). Each construct was performed with a minimum of three replicates. Error bars indicate standard error.

