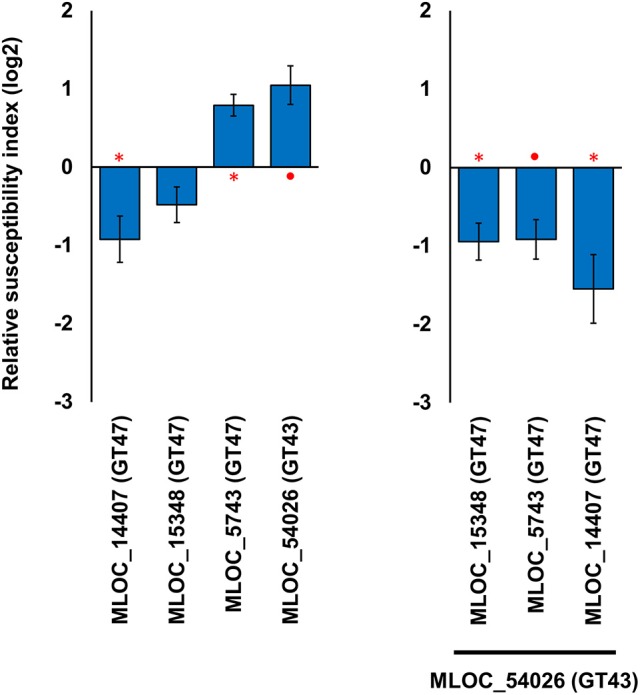
Figure 5.

Effects of individual and combined expression of GT43 and GT47 members on host susceptibility level. The left hand panel shows the effects of the genes individually, and the right hand panel shows the effects of the three GT47 genes in the co-expressed with the single GT43 gene. The relative susceptibility index (RSI) was calculated as fold-changes (log2) normalized against the empty vector control. Individual constructs with an asterisk (*) displayed a statistically significant (p < 0.05, one sample t-test) difference compared to the empty vector construct, while constructs with a solid circle (•) were close to the statistical cut-off (0.05 < p < 0.1). Each construct was performed with a minimum of three replicates. Error bars indicate standard error.
