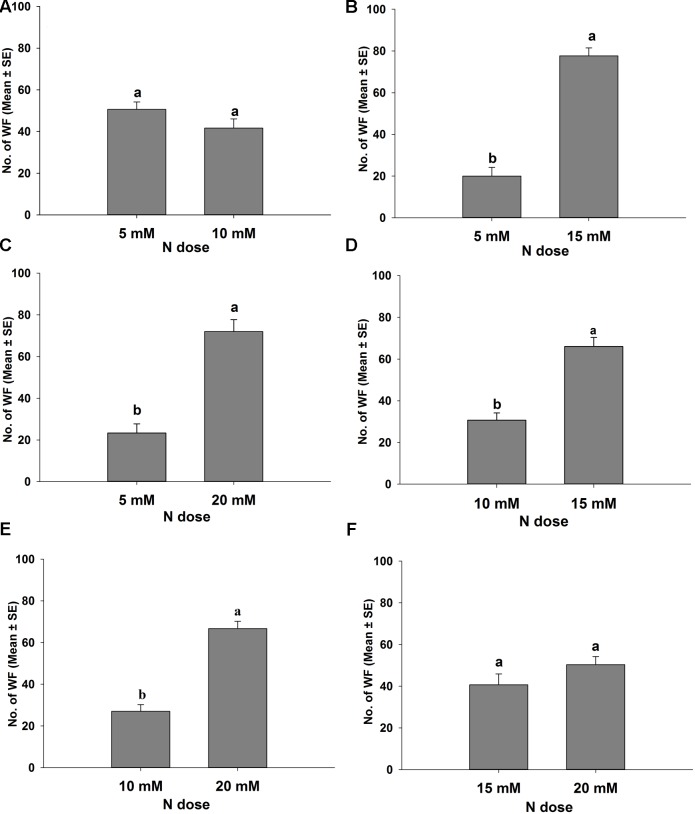
FIGURE 2.
Response of Bemisia tabaci females in different levels of nitrogen applied tomato plants in a wind tunnel experiment. Different letters are denoted significantly different at P < 0.05, and the same letters are denoted not-significant at P = 0.05 (Paired t-test). (A) 5 and 10 mM N; (B) 5 and 15 mM N; (C) 5 and 20 mM N; (D) 10 and 15 mM N; (E) 10 and 20 mM N; (F) 15 and 20 mM N treated tomato plants.

