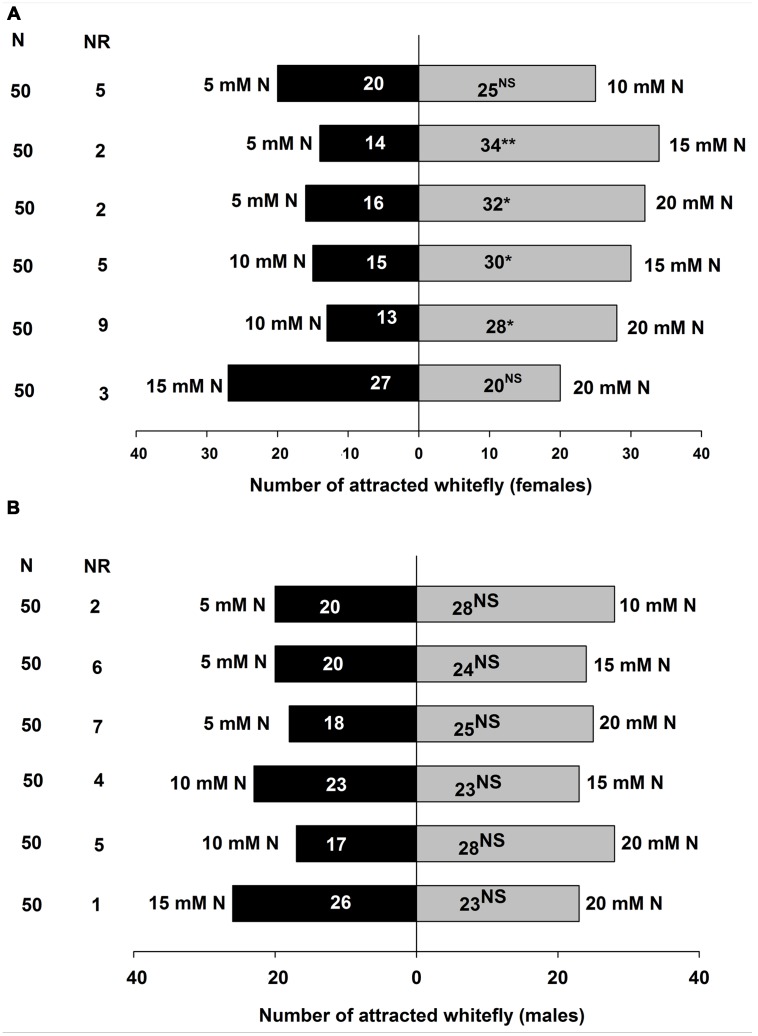
FIGURE 4.
Olfactory responses of B. tabaci females (A) and males (B) in Y-tube olfactometer assay given a choice between volatile compounds from tomato plants treated with different doses of nitrogen. N, numbers of B. tabaci females and males tested. NR, Number of non-responsive insects. NS, Not significantly different at P = 0.05. ∗, Significantly different at P < 0.05. ∗∗, Significantly different at P < 0.01 (X2 test).

