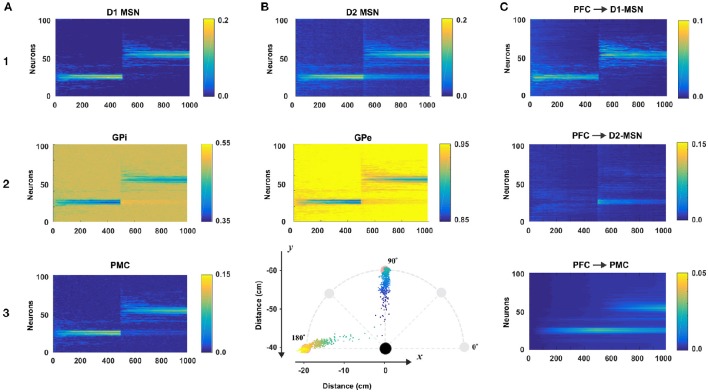
Figure 4.
Model performance. All plots are averages of 100 simulations each run for 1,000 reaching trials. In all simulations, only one sensory cue was activated. During first 500 trials the rewarding spot was within 10 cm distance from the north target (at 90° on B3). After 500 trials the target was switched to the west (180° on B3). The first 500 trials comprise the acquisition phase in which the BG create an initial cue-action association via reinforcement learning. During last 500 trials, the BG suppress old no longer desirable cue-associations and explore for new ones to get larger rewards. Thus, the active cue associates with a new reaching direction. Total 100 experiment sessions were averaged by trial. (A1–3 and B1,B2) The raster plots of BG nodes: D1-MSN, GPi, PMC, D2-MSN, and GPe. (B3) Mean reaching positions across 100 session (colored dots). For the first 500 trials, dots are headed for the north (90°) and for the last 500 trials, dots are headed for the west (180°). (C) The dynamics of the weights of connections from the PFC neuron representing the active cue to D1-, D2-MSNs, and PMC neurons.

