
FIGURE 4.
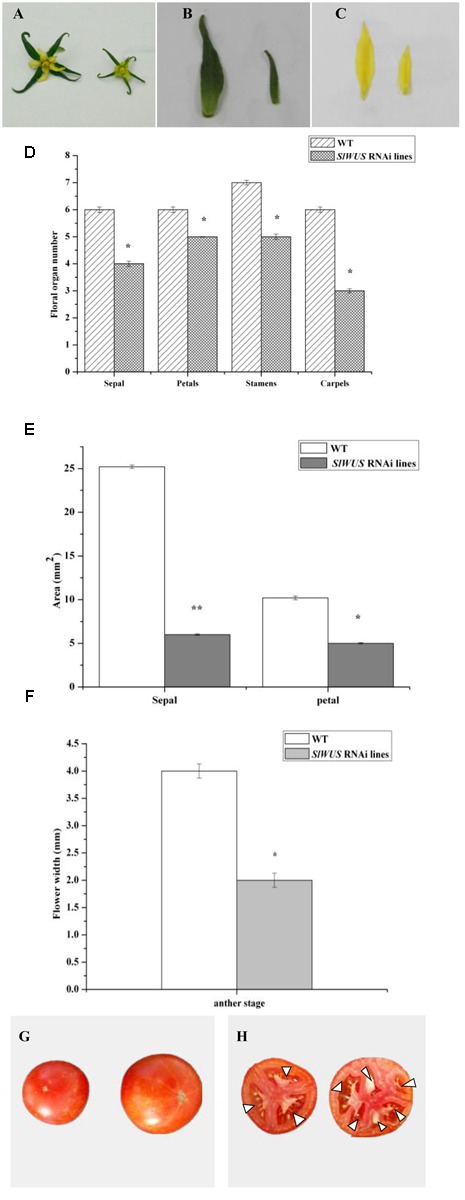
Alteration of flower and fruit morphometrical characteristics in SlWUS RNAi plants. (A) WT (left) and SlWUS RNAi plant flowers at anthesis. (B) WT (left) and SlWUS RNAi plants sepals at anthesis. (C) WT (left) and SlWUS RNAi plants petals at anthesis. (D) Mean comparison of the organ number in the four floral whorls at the anthesis stage. (E) Quantification of sepal and petal area in the control and SlWUS RNAi plant flowers at anthesis. The bars represent the standard error (n ≥ 100). (F) Mean comparison of flower width at the anthesis stage. (G) WT (right) and SlWUS RNAi plant mature fruit. (H) WT (right) and SlWUS RNAi plant fruit locule number. The data are presented as the mean (±SE) values corresponding to three independent experiments. ∗Indicates significant differences between transgenic lines and WT plants at P < 0.05, according to Duncan’s multiple range test. ∗∗Indicates significant differences between transgenic lines and WT plants at P < 0.01.