
FIGURE 5.
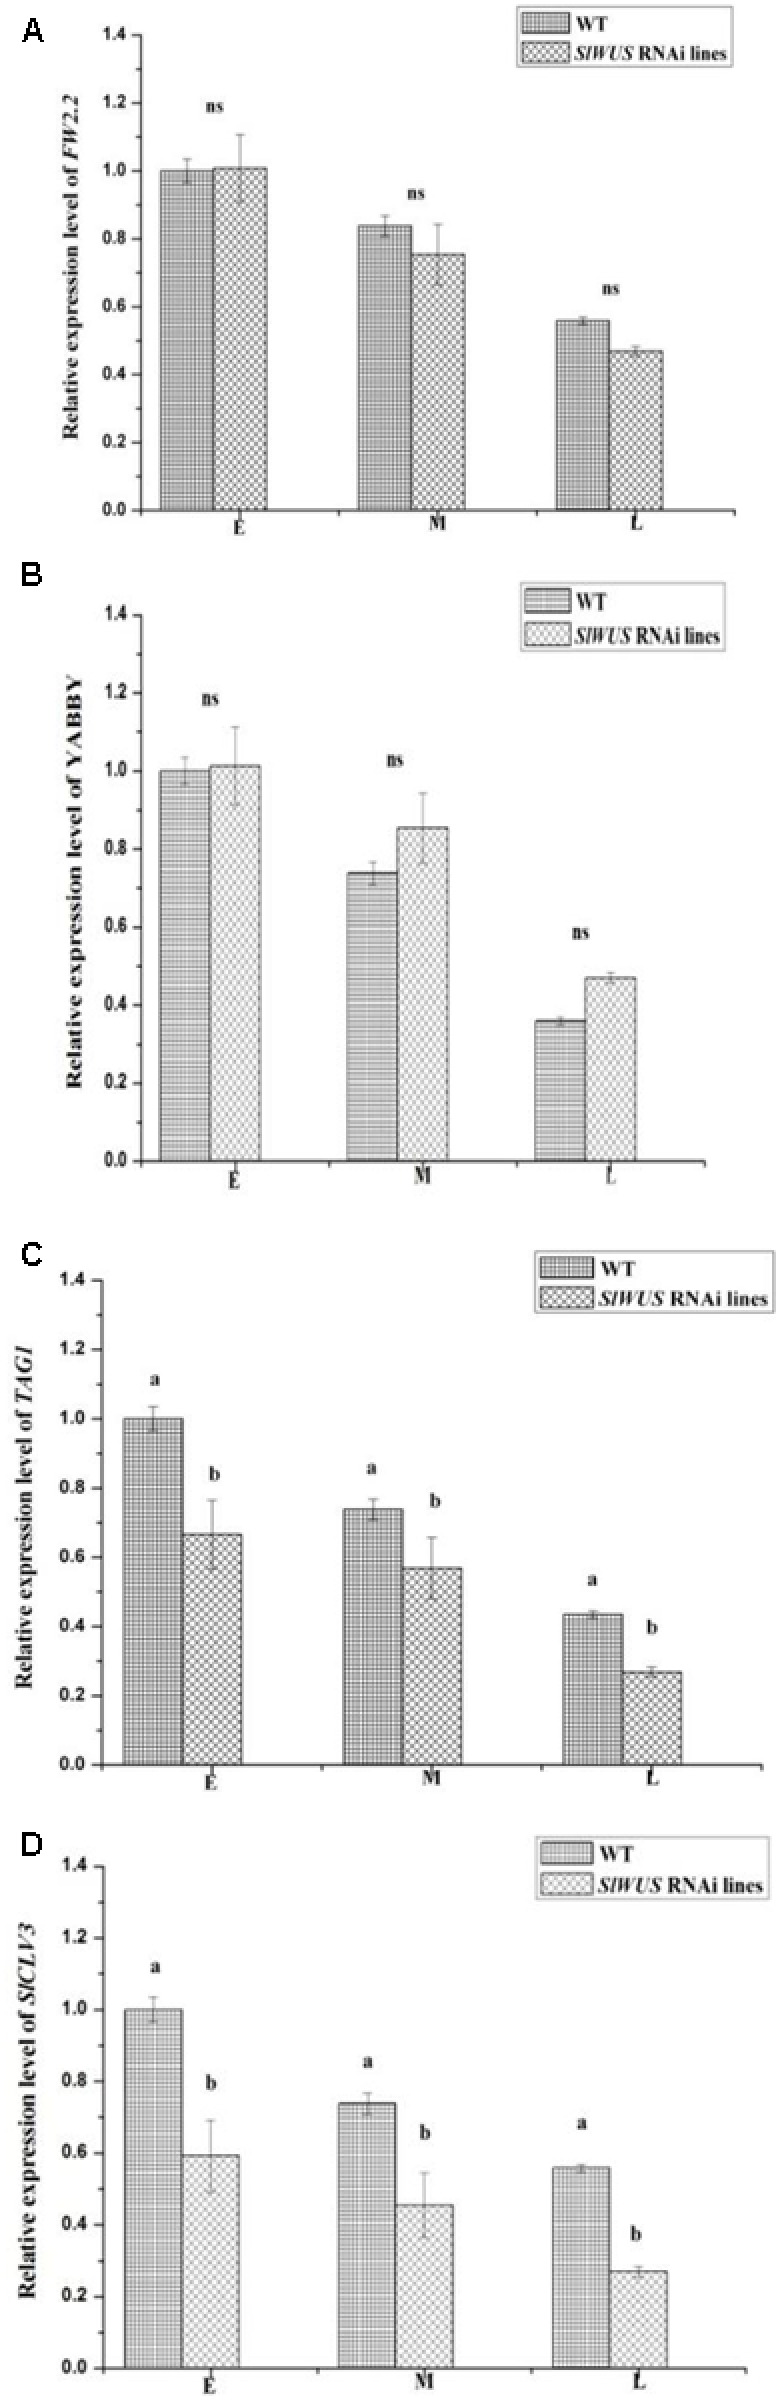
Expression analysis of (A) FW2.2, (B) YABBY, (C) TAG1, and (D) SlCLV3 during flower development. E, early development before the initiation of carpel primordial; M, mid-stage development shortly after carpel initiation; and L, late-stage development. The data are presented as the mean (±SE) values corresponding to three independent experiments. ns, no statistically significant differences. Values followed by the same letter (a or b) are not significantly different (P > 0.05).